

8 Towards Laser Intensity Calibration Using High-Field Ionization
165
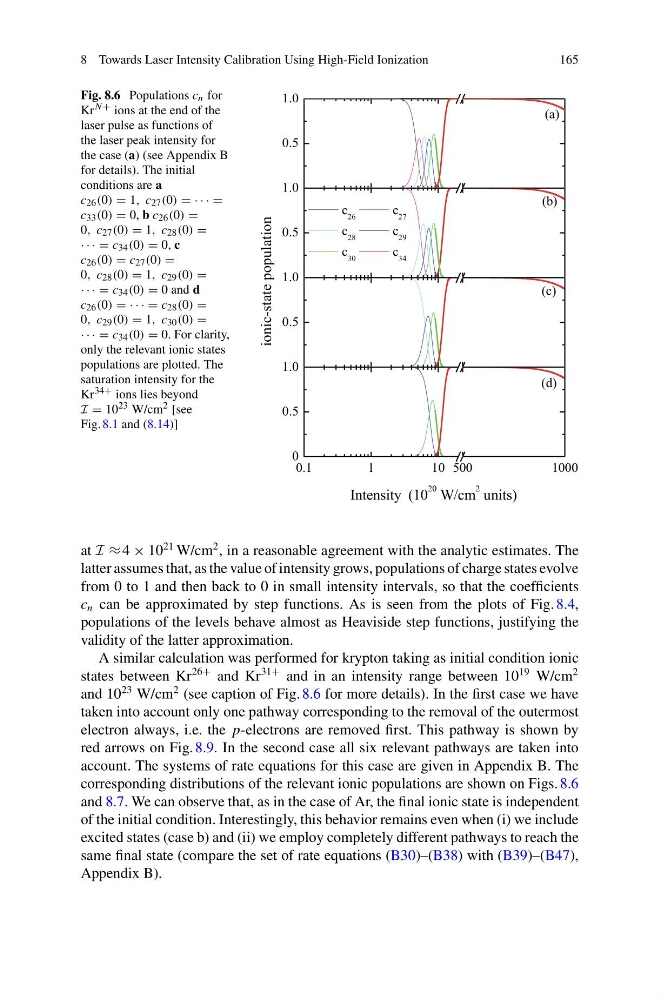
Fig. 8.6 Populations c n for
Kr N + ions at the end of the
laser pulse as functions of
the laser peak intensity for
the case (a) (see Appendix B
for details). The initial
conditions are a
c 26 (0) = 1, c 27 (0) = · · · =
c 33 (0) = 0, b c 26 (0) =
0, c 27 (0) = 1, c 28 (0) =
· · · = c 34 (0) = 0, c
c 26 (0) = c 27 (0) =
0, c 28 (0) = 1, c 29 (0) =
· · · = c 34 (0) = 0 and d
c 26 (0) = · · · = c 28 (0) =
0, c 29 (0) = 1, c 30 (0) =
· · · = c 34 (0) = 0. For clarity,
only the relevant ionic states
populations are plotted. The
saturation intensity for the
Kr 34+ ions lies beyond
I = 10 23 W/cm 2 [see
Fig. 8.1 and (8.14)]
0.5
1.0
(d)
(c)
(b)
c 26
c 27
c 28
c 29
c 30
c 34
(a)
0.5
1.0
0.5
1.0
ionic-state population
0.1
1
10 500
1000
0
0.5
1.0
Intensity (10
20 W/cm
2 units)
at I ≈ 4 × 10
21 W/cm
2 , in a reasonable agreement with the analytic estimates. The
latter assumes that, as the value of intensity grows, populations of charge states evolve
from 0 to 1 and then back to 0 in small intensity intervals, so that the coefficients
c n can be approximated by step functions. As is seen from the plots of Fig. 8.4,
populations of the levels behave almost as Heaviside step functions, justifying the
validity of the latter approximation.
A similar calculation was performed for krypton taking as initial condition ionic
states between Kr
26+ and Kr
31+ and in an intensity range between 10
19 W/cm
2
and 10
23 W/cm
2 (see caption of Fig. 8.6 for more details). In the first case we have
taken into account only one pathway corresponding to the removal of the outermost
electron always, i.e. the p-electrons are removed first. This pathway is shown by
red arrows on Fig. 8.9. In the second case all six relevant pathways are taken into
account. The systems of rate equations for this case are given in Appendix B. The
corresponding distributions of the relevant ionic populations are shown on Figs. 8.6
and 8.7. We can observe that, as in the case of Ar, the final ionic state is independent
of the initial condition. Interestingly, this behavior remains even when (i) we include
excited states (case b) and (ii) we employ completely different pathways to reach the
same final state (compare the set of rate equations (B30)–(B38) with (B39)–(B47),
Appendix B).
165
Fig. 8.6 Populations c n for
Kr N + ions at the end of the
laser pulse as functions of
the laser peak intensity for
the case (a) (see Appendix B
for details). The initial
conditions are a
c 26 (0) = 1, c 27 (0) = · · · =
c 33 (0) = 0, b c 26 (0) =
0, c 27 (0) = 1, c 28 (0) =
· · · = c 34 (0) = 0, c
c 26 (0) = c 27 (0) =
0, c 28 (0) = 1, c 29 (0) =
· · · = c 34 (0) = 0 and d
c 26 (0) = · · · = c 28 (0) =
0, c 29 (0) = 1, c 30 (0) =
· · · = c 34 (0) = 0. For clarity,
only the relevant ionic states
populations are plotted. The
saturation intensity for the
Kr 34+ ions lies beyond
I = 10 23 W/cm 2 [see
Fig. 8.1 and (8.14)]
0.5
1.0
(d)
(c)
(b)
c 26
c 27
c 28
c 29
c 30
c 34
(a)
0.5
1.0
0.5
1.0
ionic-state population
0.1
1
10 500
1000
0
0.5
1.0
Intensity (10
20 W/cm
2 units)
at I ≈ 4 × 10
21 W/cm
2 , in a reasonable agreement with the analytic estimates. The
latter assumes that, as the value of intensity grows, populations of charge states evolve
from 0 to 1 and then back to 0 in small intensity intervals, so that the coefficients
c n can be approximated by step functions. As is seen from the plots of Fig. 8.4,
populations of the levels behave almost as Heaviside step functions, justifying the
validity of the latter approximation.
A similar calculation was performed for krypton taking as initial condition ionic
states between Kr
26+ and Kr
31+ and in an intensity range between 10
19 W/cm
2
and 10
23 W/cm
2 (see caption of Fig. 8.6 for more details). In the first case we have
taken into account only one pathway corresponding to the removal of the outermost
electron always, i.e. the p-electrons are removed first. This pathway is shown by
red arrows on Fig. 8.9. In the second case all six relevant pathways are taken into
account. The systems of rate equations for this case are given in Appendix B. The
corresponding distributions of the relevant ionic populations are shown on Figs. 8.6
and 8.7. We can observe that, as in the case of Ar, the final ionic state is independent
of the initial condition. Interestingly, this behavior remains even when (i) we include
excited states (case b) and (ii) we employ completely different pathways to reach the
same final state (compare the set of rate equations (B30)–(B38) with (B39)–(B47),
Appendix B).