

160
M. F. Ciappina et al.
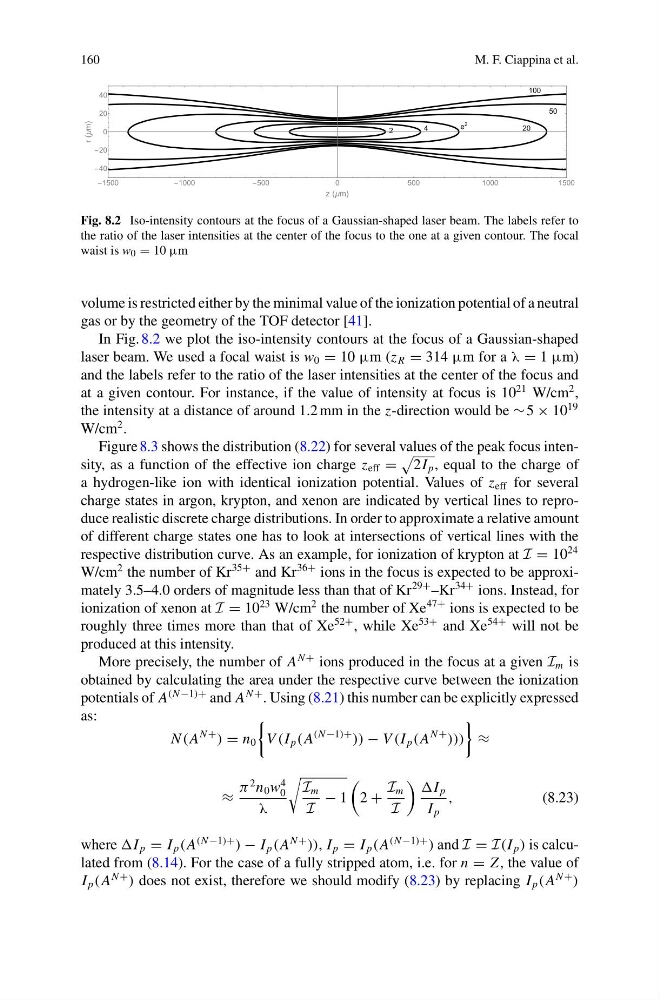
Fig. 8.2 Iso-intensity contours at the focus of a Gaussian-shaped laser beam. The labels refer to
the ratio of the laser intensities at the center of the focus to the one at a given contour. The focal
waist is w 0 = 10 μm
volume is restricted either by the minimal value of the ionization potential of a neutral
gas or by the geometry of the TOF detector [41].
In Fig. 8.2 we plot the iso-intensity contours at the focus of a Gaussian-shaped
laser beam. We used a focal waist is w 0 = 10 μm (z R = 314 μm for a λ = 1 μm)
and the labels refer to the ratio of the laser intensities at the center of the focus and
at a given contour. For instance, if the value of intensity at focus is 10
21 W/cm
2 ,
the intensity at a distance of around 1.2 mm in the z-direction would be ∼ 5 × 10
19
W/cm
2 .
Figure 8.3 shows the distribution (8.22) for several values of the peak focus intensity, as a function of the effective ion charge z eff =
2I p , equal to the charge of
a hydrogen-like ion with identical ionization potential. Values of z eff for several
charge states in argon, krypton, and xenon are indicated by vertical lines to reproduce realistic discrete charge distributions. In order to approximate a relative amount
of different charge states one has to look at intersections of vertical lines with the
respective distribution curve. As an example, for ionization of krypton at I = 10
24
W/cm
2 the number of Kr
35+ and Kr
36+ ions in the focus is expected to be approximately 3.5–4.0 orders of magnitude less than that of Kr
29+ –Kr
34+ ions. Instead, for
ionization of xenon at I = 10
23 W/cm
2 the number of Xe
47+ ions is expected to be
roughly three times more than that of Xe
52+ , while Xe
53+ and Xe
54+ will not be
produced at this intensity.
More precisely, the number of A
N + ions produced in the focus at a given I m is
obtained by calculating the area under the respective curve between the ionization
potentials of A
(N −1)+ and A
N + . Using (8.21) this number can be explicitly expressed
as:
N (A
N +
) = n 0
V (I p (A
(N −1)+
)) − V (I p (A
N +
)))
≈
≈
π
2 n 0 w
4
0
λ
I m
I
− 1
2 +
I m
I
p
I p
,
(8.23)
where p = I p (A
(N −1)+
) − I p (A
N +
)), I p = I p (A
(N −1)+
) and I = I(I p ) is calculated from (8.14). For the case of a fully stripped atom, i.e. for n = Z , the value of
I p (A
N +
) does not exist, therefore we should modify (8.23) by replacing I p (A
N +
)
M. F. Ciappina et al.
Fig. 8.2 Iso-intensity contours at the focus of a Gaussian-shaped laser beam. The labels refer to
the ratio of the laser intensities at the center of the focus to the one at a given contour. The focal
waist is w 0 = 10 μm
volume is restricted either by the minimal value of the ionization potential of a neutral
gas or by the geometry of the TOF detector [41].
In Fig. 8.2 we plot the iso-intensity contours at the focus of a Gaussian-shaped
laser beam. We used a focal waist is w 0 = 10 μm (z R = 314 μm for a λ = 1 μm)
and the labels refer to the ratio of the laser intensities at the center of the focus and
at a given contour. For instance, if the value of intensity at focus is 10
21 W/cm
2 ,
the intensity at a distance of around 1.2 mm in the z-direction would be ∼ 5 × 10
19
W/cm
2 .
Figure 8.3 shows the distribution (8.22) for several values of the peak focus intensity, as a function of the effective ion charge z eff =
2I p , equal to the charge of
a hydrogen-like ion with identical ionization potential. Values of z eff for several
charge states in argon, krypton, and xenon are indicated by vertical lines to reproduce realistic discrete charge distributions. In order to approximate a relative amount
of different charge states one has to look at intersections of vertical lines with the
respective distribution curve. As an example, for ionization of krypton at I = 10
24
W/cm
2 the number of Kr
35+ and Kr
36+ ions in the focus is expected to be approximately 3.5–4.0 orders of magnitude less than that of Kr
29+ –Kr
34+ ions. Instead, for
ionization of xenon at I = 10
23 W/cm
2 the number of Xe
47+ ions is expected to be
roughly three times more than that of Xe
52+ , while Xe
53+ and Xe
54+ will not be
produced at this intensity.
More precisely, the number of A
N + ions produced in the focus at a given I m is
obtained by calculating the area under the respective curve between the ionization
potentials of A
(N −1)+ and A
N + . Using (8.21) this number can be explicitly expressed
as:
N (A
N +
) = n 0
V (I p (A
(N −1)+
)) − V (I p (A
N +
)))
≈
≈
π
2 n 0 w
4
0
λ
I m
I
− 1
2 +
I m
I
p
I p
,
(8.23)
where p = I p (A
(N −1)+
) − I p (A
N +
)), I p = I p (A
(N −1)+
) and I = I(I p ) is calculated from (8.14). For the case of a fully stripped atom, i.e. for n = Z , the value of
I p (A
N +
) does not exist, therefore we should modify (8.23) by replacing I p (A
N +
)