

144
M. Kanasaki et al.
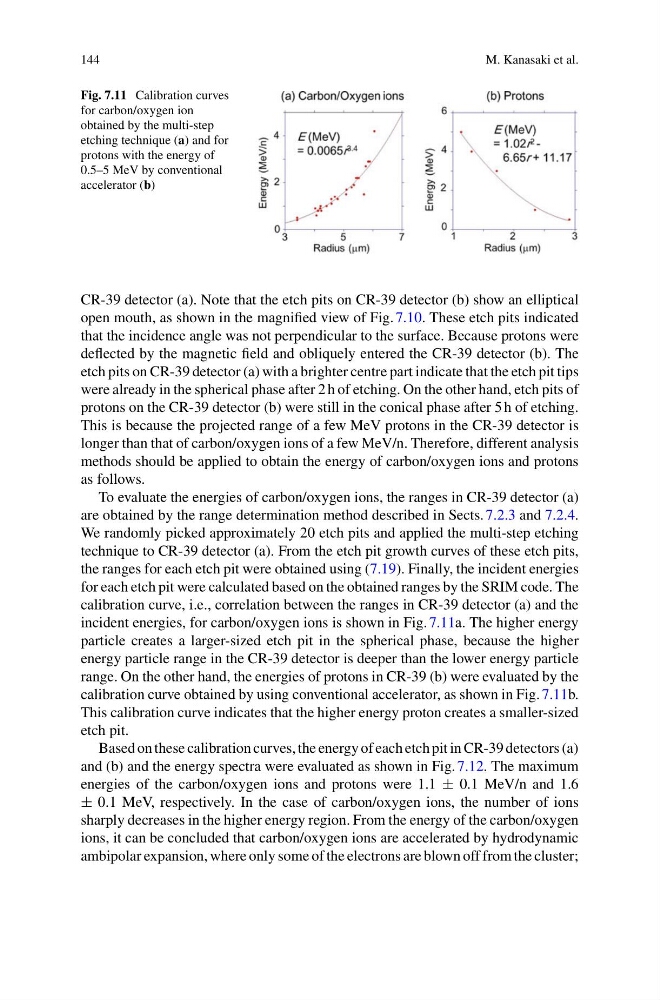
Fig. 7.11 Calibration curves
for carbon/oxygen ion
obtained by the multi-step
etching technique (a) and for
protons with the energy of
0.5–5 MeV by conventional
accelerator (b)
CR-39 detector (a). Note that the etch pits on CR-39 detector (b) show an elliptical
open mouth, as shown in the magnified view of Fig. 7.10. These etch pits indicated
that the incidence angle was not perpendicular to the surface. Because protons were
deflected by the magnetic field and obliquely entered the CR-39 detector (b). The
etch pits on CR-39 detector (a) with a brighter centre part indicate that the etch pit tips
were already in the spherical phase after 2 h of etching. On the other hand, etch pits of
protons on the CR-39 detector (b) were still in the conical phase after 5 h of etching.
This is because the projected range of a few MeV protons in the CR-39 detector is
longer than that of carbon/oxygen ions of a few MeV/n. Therefore, different analysis
methods should be applied to obtain the energy of carbon/oxygen ions and protons
as follows.
To evaluate the energies of carbon/oxygen ions, the ranges in CR-39 detector (a)
are obtained by the range determination method described in Sects. 7.2.3 and 7.2.4.
We randomly picked approximately 20 etch pits and applied the multi-step etching
technique to CR-39 detector (a). From the etch pit growth curves of these etch pits,
the ranges for each etch pit were obtained using (7.19). Finally, the incident energies
for each etch pit were calculated based on the obtained ranges by the SRIM code. The
calibration curve, i.e., correlation between the ranges in CR-39 detector (a) and the
incident energies, for carbon/oxygen ions is shown in Fig. 7.11a. The higher energy
particle creates a larger-sized etch pit in the spherical phase, because the higher
energy particle range in the CR-39 detector is deeper than the lower energy particle
range. On the other hand, the energies of protons in CR-39 (b) were evaluated by the
calibration curve obtained by using conventional accelerator, as shown in Fig. 7.11b.
This calibration curve indicates that the higher energy proton creates a smaller-sized
etch pit.
Based on these calibration curves, the energy of each etch pit in CR-39 detectors (a)
and (b) and the energy spectra were evaluated as shown in Fig. 7.12. The maximum
energies of the carbon/oxygen ions and protons were 1.1 ± 0.1 MeV/n and 1.6
± 0.1 MeV, respectively. In the case of carbon/oxygen ions, the number of ions
sharply decreases in the higher energy region. From the energy of the carbon/oxygen
ions, it can be concluded that carbon/oxygen ions are accelerated by hydrodynamic
ambipolar expansion, where only some of the electrons are blown off from the cluster;
M. Kanasaki et al.
Fig. 7.11 Calibration curves
for carbon/oxygen ion
obtained by the multi-step
etching technique (a) and for
protons with the energy of
0.5–5 MeV by conventional
accelerator (b)
CR-39 detector (a). Note that the etch pits on CR-39 detector (b) show an elliptical
open mouth, as shown in the magnified view of Fig. 7.10. These etch pits indicated
that the incidence angle was not perpendicular to the surface. Because protons were
deflected by the magnetic field and obliquely entered the CR-39 detector (b). The
etch pits on CR-39 detector (a) with a brighter centre part indicate that the etch pit tips
were already in the spherical phase after 2 h of etching. On the other hand, etch pits of
protons on the CR-39 detector (b) were still in the conical phase after 5 h of etching.
This is because the projected range of a few MeV protons in the CR-39 detector is
longer than that of carbon/oxygen ions of a few MeV/n. Therefore, different analysis
methods should be applied to obtain the energy of carbon/oxygen ions and protons
as follows.
To evaluate the energies of carbon/oxygen ions, the ranges in CR-39 detector (a)
are obtained by the range determination method described in Sects. 7.2.3 and 7.2.4.
We randomly picked approximately 20 etch pits and applied the multi-step etching
technique to CR-39 detector (a). From the etch pit growth curves of these etch pits,
the ranges for each etch pit were obtained using (7.19). Finally, the incident energies
for each etch pit were calculated based on the obtained ranges by the SRIM code. The
calibration curve, i.e., correlation between the ranges in CR-39 detector (a) and the
incident energies, for carbon/oxygen ions is shown in Fig. 7.11a. The higher energy
particle creates a larger-sized etch pit in the spherical phase, because the higher
energy particle range in the CR-39 detector is deeper than the lower energy particle
range. On the other hand, the energies of protons in CR-39 (b) were evaluated by the
calibration curve obtained by using conventional accelerator, as shown in Fig. 7.11b.
This calibration curve indicates that the higher energy proton creates a smaller-sized
etch pit.
Based on these calibration curves, the energy of each etch pit in CR-39 detectors (a)
and (b) and the energy spectra were evaluated as shown in Fig. 7.12. The maximum
energies of the carbon/oxygen ions and protons were 1.1 ± 0.1 MeV/n and 1.6
± 0.1 MeV, respectively. In the case of carbon/oxygen ions, the number of ions
sharply decreases in the higher energy region. From the energy of the carbon/oxygen
ions, it can be concluded that carbon/oxygen ions are accelerated by hydrodynamic
ambipolar expansion, where only some of the electrons are blown off from the cluster;