

7 Application of CR-39 Solid State Nuclear Track Detectors …
143
as that of the fully striped carbon ions. Additionally, carbon/oxygen ions with an
energy lower than 0.6 MeV/n cannot penetrate the Al filter with a thickness of 6
µm. To measure carbon/oxygen ions, the detector (a) was installed at the position for
the carbon/oxygen ions with energies larger than 0.6 MeV/n. On the other hand, the
detector (b) was installed at the position for the carbon/oxygen ions with energies
smaller than 0.6 MeV/n to measure the protons. In addition, the width of the slit
before the magnet was also determined to be 2 mm to avoid overlapping protons and
carbon/oxygen ions. Based on the calculation results, the CR-39 detectors (a) and
(b) can simultaneously measure carbon/oxygen ions with energies larger than 0.7
MeV/n and protons with an energy range of 0.55–2.5 MeV, respectively.
After accumulating 1000 laser shots, CR-39 samples were chemically etched in
a stirred 6 M KOH solution kept at 70
◦ C using the multi-step etching technique to
obtain the etch pit growth curve. To obtain a spatial distribution of the etch pits on the
etched samples, 1 × 6.5 cm
2 surfaces of the CR-39 samples were scanned using a
fast automated digital imaging optical microscope (HSP-1000, Seiko Precision Inc.).
The structure of the etch pits open mouths was processed with the HspFit software
(Seiko Precision Inc.).
7.3.2 Energy Spectra of Laser-Accelerated Ions
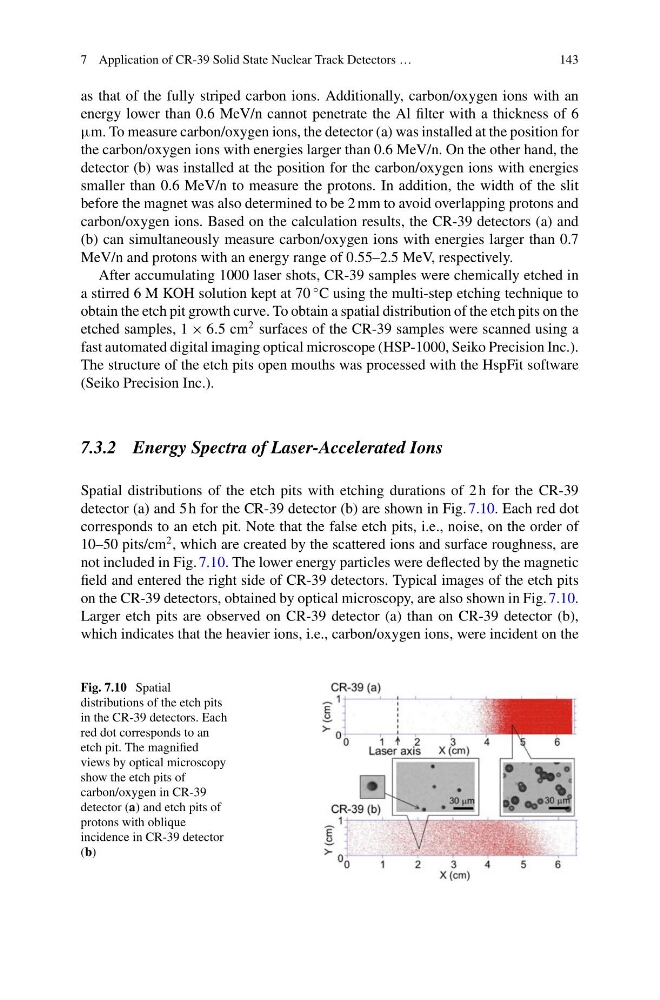
Spatial distributions of the etch pits with etching durations of 2 h for the CR-39
detector (a) and 5 h for the CR-39 detector (b) are shown in Fig. 7.10. Each red dot
corresponds to an etch pit. Note that the false etch pits, i.e., noise, on the order of
10–50 pits/cm
2 , which are created by the scattered ions and surface roughness, are
not included in Fig. 7.10. The lower energy particles were deflected by the magnetic
field and entered the right side of CR-39 detectors. Typical images of the etch pits
on the CR-39 detectors, obtained by optical microscopy, are also shown in Fig. 7.10.
Larger etch pits are observed on CR-39 detector (a) than on CR-39 detector (b),
which indicates that the heavier ions, i.e., carbon/oxygen ions, were incident on the
Fig. 7.10 Spatial
distributions of the etch pits
in the CR-39 detectors. Each
red dot corresponds to an
etch pit. The magnified
views by optical microscopy
show the etch pits of
carbon/oxygen in CR-39
detector (a) and etch pits of
protons with oblique
incidence in CR-39 detector
(b)
143
as that of the fully striped carbon ions. Additionally, carbon/oxygen ions with an
energy lower than 0.6 MeV/n cannot penetrate the Al filter with a thickness of 6
µm. To measure carbon/oxygen ions, the detector (a) was installed at the position for
the carbon/oxygen ions with energies larger than 0.6 MeV/n. On the other hand, the
detector (b) was installed at the position for the carbon/oxygen ions with energies
smaller than 0.6 MeV/n to measure the protons. In addition, the width of the slit
before the magnet was also determined to be 2 mm to avoid overlapping protons and
carbon/oxygen ions. Based on the calculation results, the CR-39 detectors (a) and
(b) can simultaneously measure carbon/oxygen ions with energies larger than 0.7
MeV/n and protons with an energy range of 0.55–2.5 MeV, respectively.
After accumulating 1000 laser shots, CR-39 samples were chemically etched in
a stirred 6 M KOH solution kept at 70
◦ C using the multi-step etching technique to
obtain the etch pit growth curve. To obtain a spatial distribution of the etch pits on the
etched samples, 1 × 6.5 cm
2 surfaces of the CR-39 samples were scanned using a
fast automated digital imaging optical microscope (HSP-1000, Seiko Precision Inc.).
The structure of the etch pits open mouths was processed with the HspFit software
(Seiko Precision Inc.).
7.3.2 Energy Spectra of Laser-Accelerated Ions
Spatial distributions of the etch pits with etching durations of 2 h for the CR-39
detector (a) and 5 h for the CR-39 detector (b) are shown in Fig. 7.10. Each red dot
corresponds to an etch pit. Note that the false etch pits, i.e., noise, on the order of
10–50 pits/cm
2 , which are created by the scattered ions and surface roughness, are
not included in Fig. 7.10. The lower energy particles were deflected by the magnetic
field and entered the right side of CR-39 detectors. Typical images of the etch pits
on the CR-39 detectors, obtained by optical microscopy, are also shown in Fig. 7.10.
Larger etch pits are observed on CR-39 detector (a) than on CR-39 detector (b),
which indicates that the heavier ions, i.e., carbon/oxygen ions, were incident on the
Fig. 7.10 Spatial
distributions of the etch pits
in the CR-39 detectors. Each
red dot corresponds to an
etch pit. The magnified
views by optical microscopy
show the etch pits of
carbon/oxygen in CR-39
detector (a) and etch pits of
protons with oblique
incidence in CR-39 detector
(b)