

7 Application of CR-39 Solid State Nuclear Track Detectors …
141
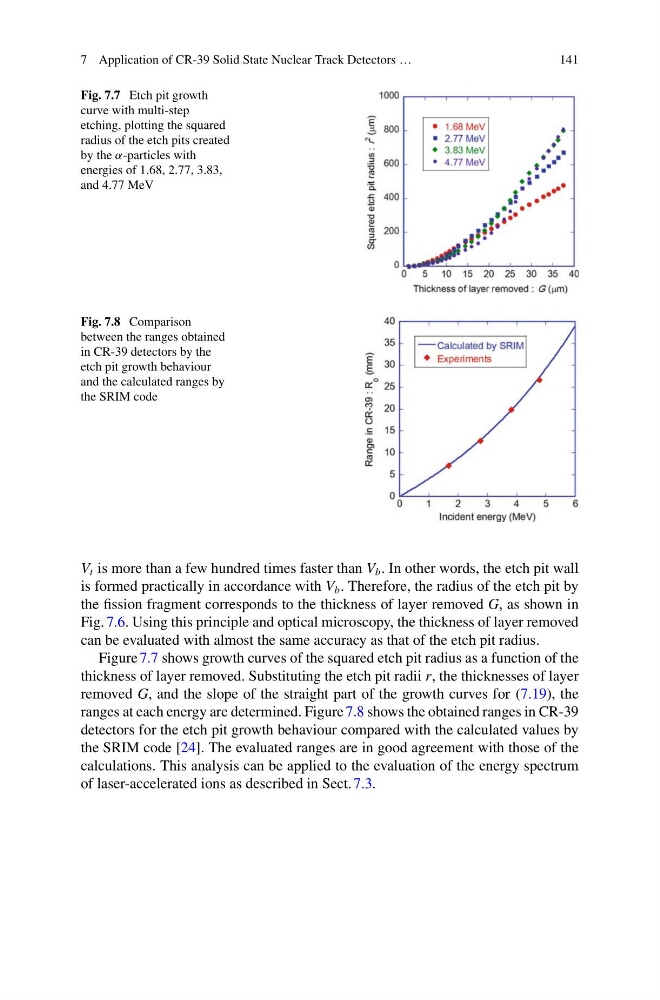
Fig. 7.7 Etch pit growth
curve with multi-step
etching, plotting the squared
radius of the etch pits created
by the α-particles with
energies of 1.68, 2.77, 3.83,
and 4.77 MeV
Fig. 7.8 Comparison
between the ranges obtained
in CR-39 detectors by the
etch pit growth behaviour
and the calculated ranges by
the SRIM code
V t is more than a few hundred times faster than V b . In other words, the etch pit wall
is formed practically in accordance with V b . Therefore, the radius of the etch pit by
the fission fragment corresponds to the thickness of layer removed G, as shown in
Fig. 7.6. Using this principle and optical microscopy, the thickness of layer removed
can be evaluated with almost the same accuracy as that of the etch pit radius.
Figure 7.7 shows growth curves of the squared etch pit radius as a function of the
thickness of layer removed. Substituting the etch pit radii r, the thicknesses of layer
removed G, and the slope of the straight part of the growth curves for (7.19), the
ranges at each energy are determined. Figure 7.8 shows the obtained ranges in CR-39
detectors for the etch pit growth behaviour compared with the calculated values by
the SRIM code [24]. The evaluated ranges are in good agreement with those of the
calculations. This analysis can be applied to the evaluation of the energy spectrum
of laser-accelerated ions as described in Sect. 7.3.
141
Fig. 7.7 Etch pit growth
curve with multi-step
etching, plotting the squared
radius of the etch pits created
by the α-particles with
energies of 1.68, 2.77, 3.83,
and 4.77 MeV
Fig. 7.8 Comparison
between the ranges obtained
in CR-39 detectors by the
etch pit growth behaviour
and the calculated ranges by
the SRIM code
V t is more than a few hundred times faster than V b . In other words, the etch pit wall
is formed practically in accordance with V b . Therefore, the radius of the etch pit by
the fission fragment corresponds to the thickness of layer removed G, as shown in
Fig. 7.6. Using this principle and optical microscopy, the thickness of layer removed
can be evaluated with almost the same accuracy as that of the etch pit radius.
Figure 7.7 shows growth curves of the squared etch pit radius as a function of the
thickness of layer removed. Substituting the etch pit radii r, the thicknesses of layer
removed G, and the slope of the straight part of the growth curves for (7.19), the
ranges at each energy are determined. Figure 7.8 shows the obtained ranges in CR-39
detectors for the etch pit growth behaviour compared with the calculated values by
the SRIM code [24]. The evaluated ranges are in good agreement with those of the
calculations. This analysis can be applied to the evaluation of the energy spectrum
of laser-accelerated ions as described in Sect. 7.3.