

2 Industrial Plant Oil Extraction
81
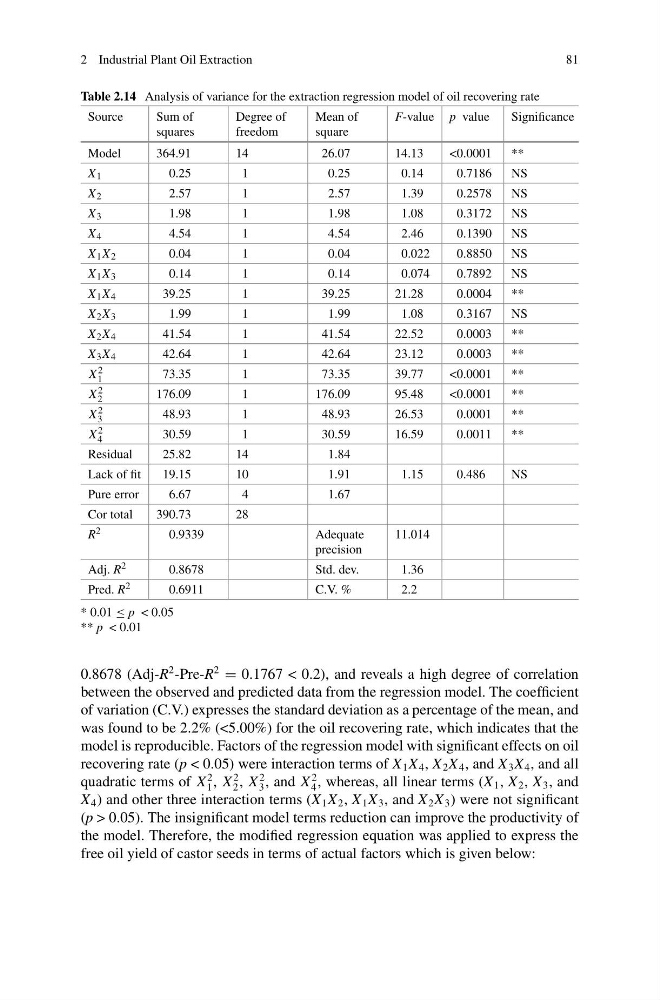
Table 2.14 Analysis of variance for the extraction regression model of oil recovering rate
Source
Sum of
squares
Degree of
freedom
Mean of
square
F-value p value
Significance
Model
364.91
14
26.07
14.13
<0.0001
**
X 1
0.25
1
0.25
0.14
0.7186
NS
X 2
2.57
1
2.57
1.39
0.2578
NS
X 3
1.98
1
1.98
1.08
0.3172
NS
X 4
4.54
1
4.54
2.46
0.1390
NS
X 1 X 2
0.04
1
0.04
0.022
0.8850
NS
X 1 X 3
0.14
1
0.14
0.074
0.7892
NS
X 1 X 4
39.25
1
39.25
21.28
0.0004
**
X 2 X 3
1.99
1
1.99
1.08
0.3167
NS
X 2 X 4
41.54
1
41.54
22.52
0.0003
**
X 3 X 4
42.64
1
42.64
23.12
0.0003
**
X 2
1
73.35
1
73.35
39.77
<0.0001
**
X 2
2
176.09
1
176.09
95.48
<0.0001
**
X 2
3
48.93
1
48.93
26.53
0.0001
**
X 2
4
30.59
1
30.59
16.59
0.0011
**
Residual
25.82
14
1.84
Lack of fit
19.15
10
1.91
1.15
0.486
NS
Pure error
6.67
4
1.67
Cor total
390.73
28
R 2
0.9339
Adequate
precision
11.014
Adj. R 2
0.8678
Std. dev.
1.36
Pred. R 2
0.6911
C.V. %
2.2
* 0.01 ≤ p < 0.05
** p < 0.01
0.8678 (Adj-R
2 -Pre-R
2
= 0.1767 < 0.2), and reveals a high degree of correlation
between the observed and predicted data from the regression model. The coefficient
of variation (C.V.) expresses the standard deviation as a percentage of the mean, and
was found to be 2.2% (<5.00%) for the oil recovering rate, which indicates that the
model is reproducible. Factors of the regression model with significant effects on oil
recovering rate (p < 0.05) were interaction terms of X 1 X 4 , X 2 X 4 , and X 3 X 4 , and all
quadratic terms of X
2
1 , X
2
2 , X
2
3 , and X
2
4 , whereas, all linear terms (X 1 , X 2 , X 3 , and
X 4 ) and other three interaction terms (X 1 X 2 , X 1 X 3 , and X 2 X 3 ) were not significant
(p > 0.05). The insignificant model terms reduction can improve the productivity of
the model. Therefore, the modified regression equation was applied to express the
free oil yield of castor seeds in terms of actual factors which is given below:
81
Table 2.14 Analysis of variance for the extraction regression model of oil recovering rate
Source
Sum of
squares
Degree of
freedom
Mean of
square
F-value p value
Significance
Model
364.91
14
26.07
14.13
<0.0001
**
X 1
0.25
1
0.25
0.14
0.7186
NS
X 2
2.57
1
2.57
1.39
0.2578
NS
X 3
1.98
1
1.98
1.08
0.3172
NS
X 4
4.54
1
4.54
2.46
0.1390
NS
X 1 X 2
0.04
1
0.04
0.022
0.8850
NS
X 1 X 3
0.14
1
0.14
0.074
0.7892
NS
X 1 X 4
39.25
1
39.25
21.28
0.0004
**
X 2 X 3
1.99
1
1.99
1.08
0.3167
NS
X 2 X 4
41.54
1
41.54
22.52
0.0003
**
X 3 X 4
42.64
1
42.64
23.12
0.0003
**
X 2
1
73.35
1
73.35
39.77
<0.0001
**
X 2
2
176.09
1
176.09
95.48
<0.0001
**
X 2
3
48.93
1
48.93
26.53
0.0001
**
X 2
4
30.59
1
30.59
16.59
0.0011
**
Residual
25.82
14
1.84
Lack of fit
19.15
10
1.91
1.15
0.486
NS
Pure error
6.67
4
1.67
Cor total
390.73
28
R 2
0.9339
Adequate
precision
11.014
Adj. R 2
0.8678
Std. dev.
1.36
Pred. R 2
0.6911
C.V. %
2.2
* 0.01 ≤ p < 0.05
** p < 0.01
0.8678 (Adj-R
2 -Pre-R
2
= 0.1767 < 0.2), and reveals a high degree of correlation
between the observed and predicted data from the regression model. The coefficient
of variation (C.V.) expresses the standard deviation as a percentage of the mean, and
was found to be 2.2% (<5.00%) for the oil recovering rate, which indicates that the
model is reproducible. Factors of the regression model with significant effects on oil
recovering rate (p < 0.05) were interaction terms of X 1 X 4 , X 2 X 4 , and X 3 X 4 , and all
quadratic terms of X
2
1 , X
2
2 , X
2
3 , and X
2
4 , whereas, all linear terms (X 1 , X 2 , X 3 , and
X 4 ) and other three interaction terms (X 1 X 2 , X 1 X 3 , and X 2 X 3 ) were not significant
(p > 0.05). The insignificant model terms reduction can improve the productivity of
the model. Therefore, the modified regression equation was applied to express the
free oil yield of castor seeds in terms of actual factors which is given below: