

80
Z. Xiao et al.
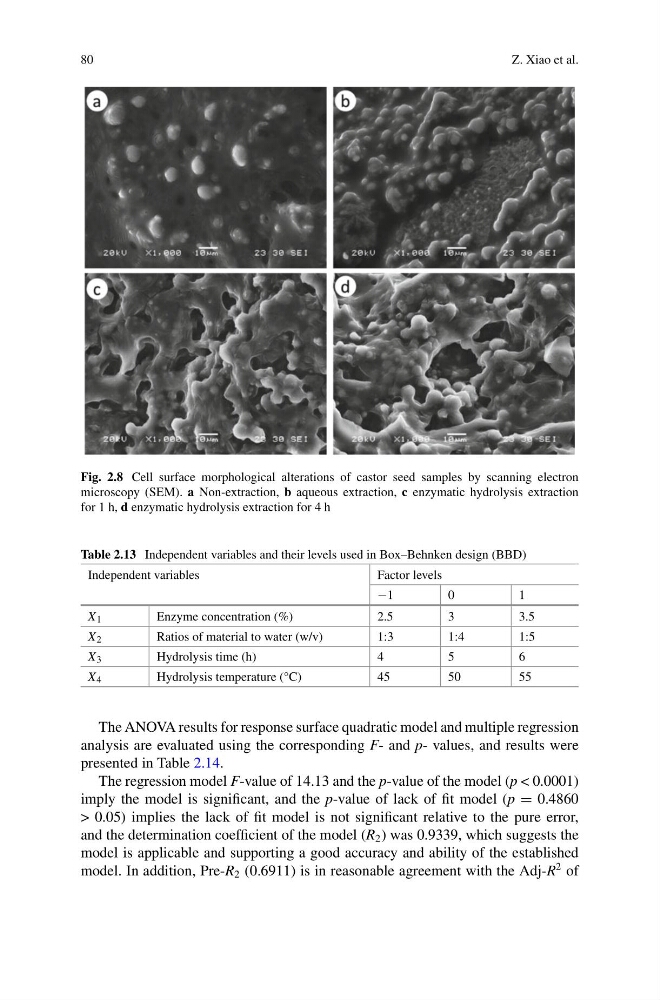
Fig. 2.8 Cell surface morphological alterations of castor seed samples by scanning electron
microscopy (SEM). a Non-extraction, b aqueous extraction, c enzymatic hydrolysis extraction
for 1 h, d enzymatic hydrolysis extraction for 4 h
Table 2.13 Independent variables and their levels used in Box–Behnken design (BBD)
Independent variables
Factor levels
−1
0
1
X 1
Enzyme concentration (%)
2.5
3
3.5
X 2
Ratios of material to water (w/v)
1:3
1:4
1:5
X 3
Hydrolysis time (h)
4
5
6
X 4
Hydrolysis temperature (°C)
45
50
55
The ANOVA results for response surface quadratic model and multiple regression
analysis are evaluated using the corresponding F- and p- values, and results were
presented in Table 2.14.
The regression model F-value of 14.13 and the p-value of the model (p < 0.0001)
imply the model is significant, and the p-value of lack of fit model (p = 0.4860
> 0.05) implies the lack of fit model is not significant relative to the pure error,
and the determination coefficient of the model (R 2 ) was 0.9339, which suggests the
model is applicable and supporting a good accuracy and ability of the established
model. In addition, Pre-R 2 (0.6911) is in reasonable agreement with the Adj-R
2 of
Z. Xiao et al.
Fig. 2.8 Cell surface morphological alterations of castor seed samples by scanning electron
microscopy (SEM). a Non-extraction, b aqueous extraction, c enzymatic hydrolysis extraction
for 1 h, d enzymatic hydrolysis extraction for 4 h
Table 2.13 Independent variables and their levels used in Box–Behnken design (BBD)
Independent variables
Factor levels
−1
0
1
X 1
Enzyme concentration (%)
2.5
3
3.5
X 2
Ratios of material to water (w/v)
1:3
1:4
1:5
X 3
Hydrolysis time (h)
4
5
6
X 4
Hydrolysis temperature (°C)
45
50
55
The ANOVA results for response surface quadratic model and multiple regression
analysis are evaluated using the corresponding F- and p- values, and results were
presented in Table 2.14.
The regression model F-value of 14.13 and the p-value of the model (p < 0.0001)
imply the model is significant, and the p-value of lack of fit model (p = 0.4860
> 0.05) implies the lack of fit model is not significant relative to the pure error,
and the determination coefficient of the model (R 2 ) was 0.9339, which suggests the
model is applicable and supporting a good accuracy and ability of the established
model. In addition, Pre-R 2 (0.6911) is in reasonable agreement with the Adj-R
2 of