

5.2 Methods of Detecting Hardware Trojans in Microcircuits Based …
475
5.2.3 Experimental Results of Method Effectiveness
Verification
Below are three main variants of presentation of the experiment on examining efficiency of the method: variant A (reference circuit compared to another reference
circuit), variant B (reference circuit compared to a HT), and variant C (Trojans of
microscopic sizes).
A. Reference circuit compared to reference circuit
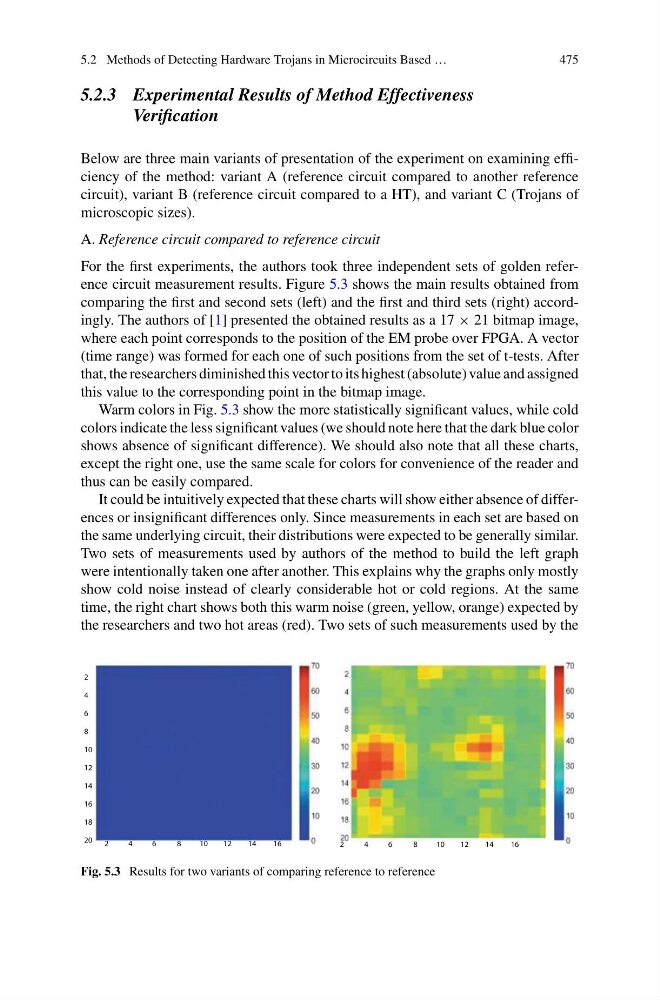
For the first experiments, the authors took three independent sets of golden reference circuit measurement results. Figure 5.3 shows the main results obtained from
comparing the first and second sets (left) and the first and third sets (right) accordingly. The authors of [1] presented the obtained results as a 17 × 21 bitmap image,
where each point corresponds to the position of the EM probe over FPGA. A vector
(time range) was formed for each one of such positions from the set of t-tests. After
that, the researchers diminished this vector to its highest (absolute) value and assigned
this value to the corresponding point in the bitmap image.
Warm colors in Fig. 5.3 show the more statistically significant values, while cold
colors indicate the less significant values (we should note here that the dark blue color
shows absence of significant difference). We should also note that all these charts,
except the right one, use the same scale for colors for convenience of the reader and
thus can be easily compared.
It could be intuitively expected that these charts will show either absence of differences or insignificant differences only. Since measurements in each set are based on
the same underlying circuit, their distributions were expected to be generally similar.
Two sets of measurements used by authors of the method to build the left graph
were intentionally taken one after another. This explains why the graphs only mostly
show cold noise instead of clearly considerable hot or cold regions. At the same
time, the right chart shows both this warm noise (green, yellow, orange) expected by
the researchers and two hot areas (red). Two sets of such measurements used by the
2
4
6
8
10
12
14
16
18
20
2
4
6
8
10
12
14
16
2
4
6
8
10
12
14
16
Fig. 5.3 Results for two variants of comparing reference to reference
475
5.2.3 Experimental Results of Method Effectiveness
Verification
Below are three main variants of presentation of the experiment on examining efficiency of the method: variant A (reference circuit compared to another reference
circuit), variant B (reference circuit compared to a HT), and variant C (Trojans of
microscopic sizes).
A. Reference circuit compared to reference circuit
For the first experiments, the authors took three independent sets of golden reference circuit measurement results. Figure 5.3 shows the main results obtained from
comparing the first and second sets (left) and the first and third sets (right) accordingly. The authors of [1] presented the obtained results as a 17 × 21 bitmap image,
where each point corresponds to the position of the EM probe over FPGA. A vector
(time range) was formed for each one of such positions from the set of t-tests. After
that, the researchers diminished this vector to its highest (absolute) value and assigned
this value to the corresponding point in the bitmap image.
Warm colors in Fig. 5.3 show the more statistically significant values, while cold
colors indicate the less significant values (we should note here that the dark blue color
shows absence of significant difference). We should also note that all these charts,
except the right one, use the same scale for colors for convenience of the reader and
thus can be easily compared.
It could be intuitively expected that these charts will show either absence of differences or insignificant differences only. Since measurements in each set are based on
the same underlying circuit, their distributions were expected to be generally similar.
Two sets of measurements used by authors of the method to build the left graph
were intentionally taken one after another. This explains why the graphs only mostly
show cold noise instead of clearly considerable hot or cold regions. At the same
time, the right chart shows both this warm noise (green, yellow, orange) expected by
the researchers and two hot areas (red). Two sets of such measurements used by the
2
4
6
8
10
12
14
16
18
20
2
4
6
8
10
12
14
16
2
4
6
8
10
12
14
16
Fig. 5.3 Results for two variants of comparing reference to reference