

474
5 Methods of Detecting Hardware Trojans in Microcircuits
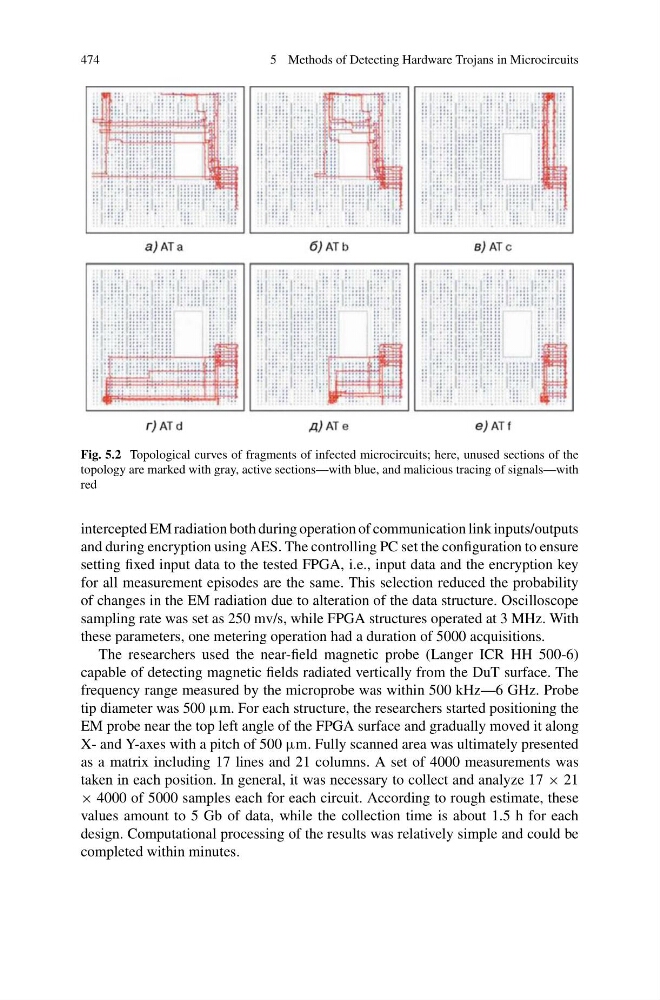
Fig. 5.2 Topological curves of fragments of infected microcircuits; here, unused sections of the
topology are marked with gray, active sections—with blue, and malicious tracing of signals—with
red
intercepted EM radiation both during operation of communication link inputs/outputs
and during encryption using AES. The controlling PC set the configuration to ensure
setting fixed input data to the tested FPGA, i.e., input data and the encryption key
for all measurement episodes are the same. This selection reduced the probability
of changes in the EM radiation due to alteration of the data structure. Oscilloscope
sampling rate was set as 250 mv/s, while FPGA structures operated at 3 MHz. With
these parameters, one metering operation had a duration of 5000 acquisitions.
The researchers used the near-field magnetic probe (Langer ICR HH 500-6)
capable of detecting magnetic fields radiated vertically from the DuT surface. The
frequency range measured by the microprobe was within 500 kHz—6 GHz. Probe
tip diameter was 500 μm. For each structure, the researchers started positioning the
EM probe near the top left angle of the FPGA surface and gradually moved it along
X- and Y-axes with a pitch of 500 μm. Fully scanned area was ultimately presented
as a matrix including 17 lines and 21 columns. A set of 4000 measurements was
taken in each position. In general, it was necessary to collect and analyze 17 × 21
× 4000 of 5000 samples each for each circuit. According to rough estimate, these
values amount to 5 Gb of data, while the collection time is about 1.5 h for each
design. Computational processing of the results was relatively simple and could be
completed within minutes.
5 Methods of Detecting Hardware Trojans in Microcircuits
Fig. 5.2 Topological curves of fragments of infected microcircuits; here, unused sections of the
topology are marked with gray, active sections—with blue, and malicious tracing of signals—with
red
intercepted EM radiation both during operation of communication link inputs/outputs
and during encryption using AES. The controlling PC set the configuration to ensure
setting fixed input data to the tested FPGA, i.e., input data and the encryption key
for all measurement episodes are the same. This selection reduced the probability
of changes in the EM radiation due to alteration of the data structure. Oscilloscope
sampling rate was set as 250 mv/s, while FPGA structures operated at 3 MHz. With
these parameters, one metering operation had a duration of 5000 acquisitions.
The researchers used the near-field magnetic probe (Langer ICR HH 500-6)
capable of detecting magnetic fields radiated vertically from the DuT surface. The
frequency range measured by the microprobe was within 500 kHz—6 GHz. Probe
tip diameter was 500 μm. For each structure, the researchers started positioning the
EM probe near the top left angle of the FPGA surface and gradually moved it along
X- and Y-axes with a pitch of 500 μm. Fully scanned area was ultimately presented
as a matrix including 17 lines and 21 columns. A set of 4000 measurements was
taken in each position. In general, it was necessary to collect and analyze 17 × 21
× 4000 of 5000 samples each for each circuit. According to rough estimate, these
values amount to 5 Gb of data, while the collection time is about 1.5 h for each
design. Computational processing of the results was relatively simple and could be
completed within minutes.