

250
A. Roy et al.
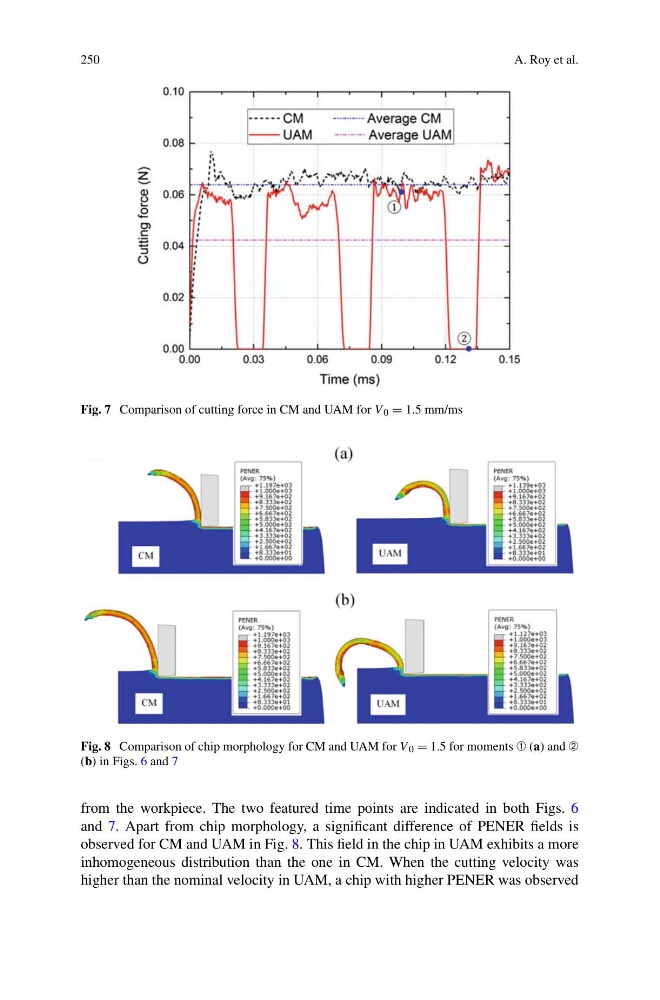
Fig. 7 Comparison of cutting force in CM and UAM for V 0 = 1.5 mm/ms
Fig. 8 Comparison of chip morphology for CM and UAM for V 0 = 1.5 for moments ➀ (a) and ➁
(b) in Figs. 6 and 7
from the workpiece. The two featured time points are indicated in both Figs. 6
and 7. Apart from chip morphology, a significant difference of PENER fields is
observed for CM and UAM in Fig. 8. This field in the chip in UAM exhibits a more
inhomogeneous distribution than the one in CM. When the cutting velocity was
higher than the nominal velocity in UAM, a chip with higher PENER was observed
A. Roy et al.
Fig. 7 Comparison of cutting force in CM and UAM for V 0 = 1.5 mm/ms
Fig. 8 Comparison of chip morphology for CM and UAM for V 0 = 1.5 for moments ➀ (a) and ➁
(b) in Figs. 6 and 7
from the workpiece. The two featured time points are indicated in both Figs. 6
and 7. Apart from chip morphology, a significant difference of PENER fields is
observed for CM and UAM in Fig. 8. This field in the chip in UAM exhibits a more
inhomogeneous distribution than the one in CM. When the cutting velocity was
higher than the nominal velocity in UAM, a chip with higher PENER was observed