

Simulations of Machining Processes at Small …
249
Fig. 5 Comparison of chip morphology in CM and UAM for V 0 = 2.0 mm/ms for moments ➀
(a) and ➁ (b) in Figs. 3 and 4
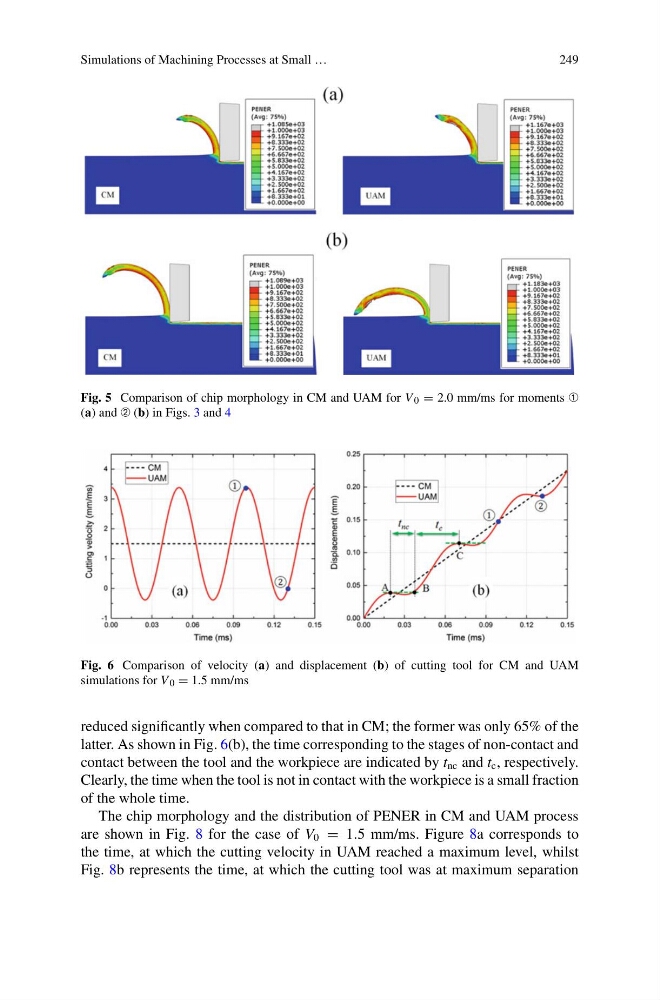
Fig. 6 Comparison of velocity (a) and displacement (b) of cutting tool for CM and UAM
simulations for V 0 = 1.5 mm/ms
reduced significantly when compared to that in CM; the former was only 65% of the
latter. As shown in Fig. 6(b), the time corresponding to the stages of non-contact and
contact between the tool and the workpiece are indicated by t nc and t c , respectively.
Clearly, the time when the tool is not in contact with the workpiece is a small fraction
of the whole time.
The chip morphology and the distribution of PENER in CM and UAM process
are shown in Fig. 8 for the case of V 0 = 1.5 mm/ms. Figure 8a corresponds to
the time, at which the cutting velocity in UAM reached a maximum level, whilst
Fig. 8b represents the time, at which the cutting tool was at maximum separation
249
Fig. 5 Comparison of chip morphology in CM and UAM for V 0 = 2.0 mm/ms for moments ➀
(a) and ➁ (b) in Figs. 3 and 4
Fig. 6 Comparison of velocity (a) and displacement (b) of cutting tool for CM and UAM
simulations for V 0 = 1.5 mm/ms
reduced significantly when compared to that in CM; the former was only 65% of the
latter. As shown in Fig. 6(b), the time corresponding to the stages of non-contact and
contact between the tool and the workpiece are indicated by t nc and t c , respectively.
Clearly, the time when the tool is not in contact with the workpiece is a small fraction
of the whole time.
The chip morphology and the distribution of PENER in CM and UAM process
are shown in Fig. 8 for the case of V 0 = 1.5 mm/ms. Figure 8a corresponds to
the time, at which the cutting velocity in UAM reached a maximum level, whilst
Fig. 8b represents the time, at which the cutting tool was at maximum separation