

248
A. Roy et al.
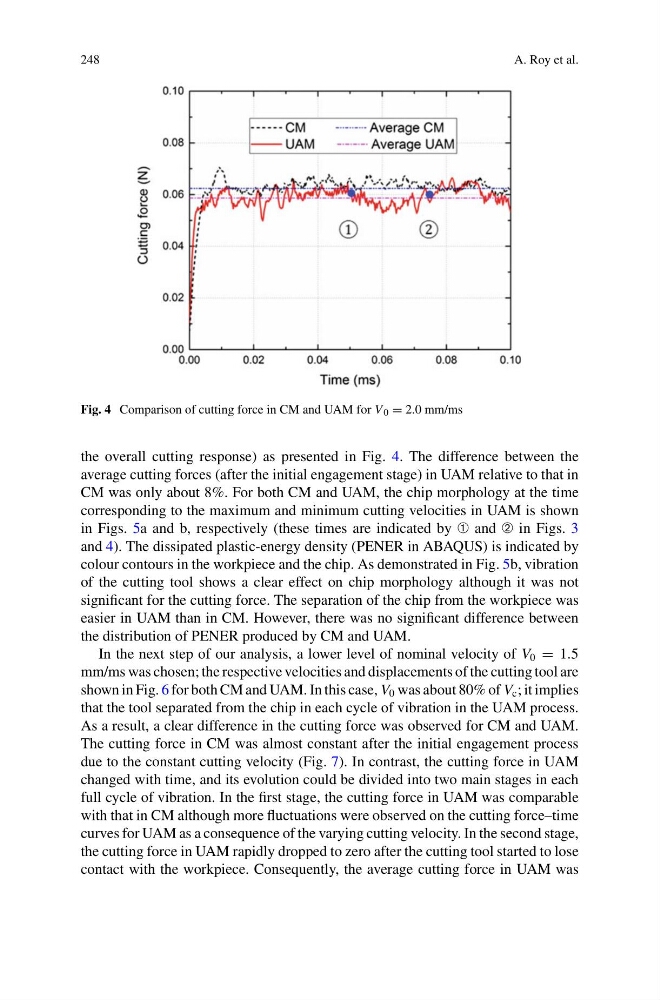
Fig. 4 Comparison of cutting force in CM and UAM for V 0 = 2.0 mm/ms
the overall cutting response) as presented in Fig. 4. The difference between the
average cutting forces (after the initial engagement stage) in UAM relative to that in
CM was only about 8%. For both CM and UAM, the chip morphology at the time
corresponding to the maximum and minimum cutting velocities in UAM is shown
in Figs. 5a and b, respectively (these times are indicated by ➀ and ➁ in Figs. 3
and 4). The dissipated plastic-energy density (PENER in ABAQUS) is indicated by
colour contours in the workpiece and the chip. As demonstrated in Fig. 5b, vibration
of the cutting tool shows a clear effect on chip morphology although it was not
significant for the cutting force. The separation of the chip from the workpiece was
easier in UAM than in CM. However, there was no significant difference between
the distribution of PENER produced by CM and UAM.
In the next step of our analysis, a lower level of nominal velocity of V 0 = 1.5
mm/ms was chosen; the respective velocities and displacements of the cutting tool are
shown in Fig. 6 for both CM and UAM. In this case, V 0 was about 80% of V c ; it implies
that the tool separated from the chip in each cycle of vibration in the UAM process.
As a result, a clear difference in the cutting force was observed for CM and UAM.
The cutting force in CM was almost constant after the initial engagement process
due to the constant cutting velocity (Fig. 7). In contrast, the cutting force in UAM
changed with time, and its evolution could be divided into two main stages in each
full cycle of vibration. In the first stage, the cutting force in UAM was comparable
with that in CM although more fluctuations were observed on the cutting force–time
curves for UAM as a consequence of the varying cutting velocity. In the second stage,
the cutting force in UAM rapidly dropped to zero after the cutting tool started to lose
contact with the workpiece. Consequently, the average cutting force in UAM was
A. Roy et al.
Fig. 4 Comparison of cutting force in CM and UAM for V 0 = 2.0 mm/ms
the overall cutting response) as presented in Fig. 4. The difference between the
average cutting forces (after the initial engagement stage) in UAM relative to that in
CM was only about 8%. For both CM and UAM, the chip morphology at the time
corresponding to the maximum and minimum cutting velocities in UAM is shown
in Figs. 5a and b, respectively (these times are indicated by ➀ and ➁ in Figs. 3
and 4). The dissipated plastic-energy density (PENER in ABAQUS) is indicated by
colour contours in the workpiece and the chip. As demonstrated in Fig. 5b, vibration
of the cutting tool shows a clear effect on chip morphology although it was not
significant for the cutting force. The separation of the chip from the workpiece was
easier in UAM than in CM. However, there was no significant difference between
the distribution of PENER produced by CM and UAM.
In the next step of our analysis, a lower level of nominal velocity of V 0 = 1.5
mm/ms was chosen; the respective velocities and displacements of the cutting tool are
shown in Fig. 6 for both CM and UAM. In this case, V 0 was about 80% of V c ; it implies
that the tool separated from the chip in each cycle of vibration in the UAM process.
As a result, a clear difference in the cutting force was observed for CM and UAM.
The cutting force in CM was almost constant after the initial engagement process
due to the constant cutting velocity (Fig. 7). In contrast, the cutting force in UAM
changed with time, and its evolution could be divided into two main stages in each
full cycle of vibration. In the first stage, the cutting force in UAM was comparable
with that in CM although more fluctuations were observed on the cutting force–time
curves for UAM as a consequence of the varying cutting velocity. In the second stage,
the cutting force in UAM rapidly dropped to zero after the cutting tool started to lose
contact with the workpiece. Consequently, the average cutting force in UAM was