

138
G. Biswas and K. C. Sahu
6.5 Boiling and Phase Change
Multiphase flows undergoing phase change are ubiquitous and have several industrial
applications, for instance, energy generation, manufacturing, combustion, etc. Phase
change in multiphase flows can also take place due to chemical reaction, evapouration, melting, etc. In saturated film boilings, the heat transfer occurs through a thin
vapour film via the formation of vapour bubbles, which transfer the heat from the
vapour film to the bulk liquid. Experimental and computational studies in boiling
have been dedicated to develop empirical correlations and to understand the detail
of boiling phenomenon and transport processes. Welch and Wilson [105] were one
of the pioneers to simulate phase change for wide range of density difference using
the VOF formulation. This work was widely acknowledged and subsequently used
by other researchers to implement the idea in other approaches and to study phase
change and boiling (e.g. the CLSVOF approach of Refs. [106] and Electro hydro
dynamics [107]). As the formation of bubbles, which follows a periodic pattern in
space and time at the liquid–vapour interface, plays an important role in the heat
transfer processes, several researchers have studied this phenomenon by conducting
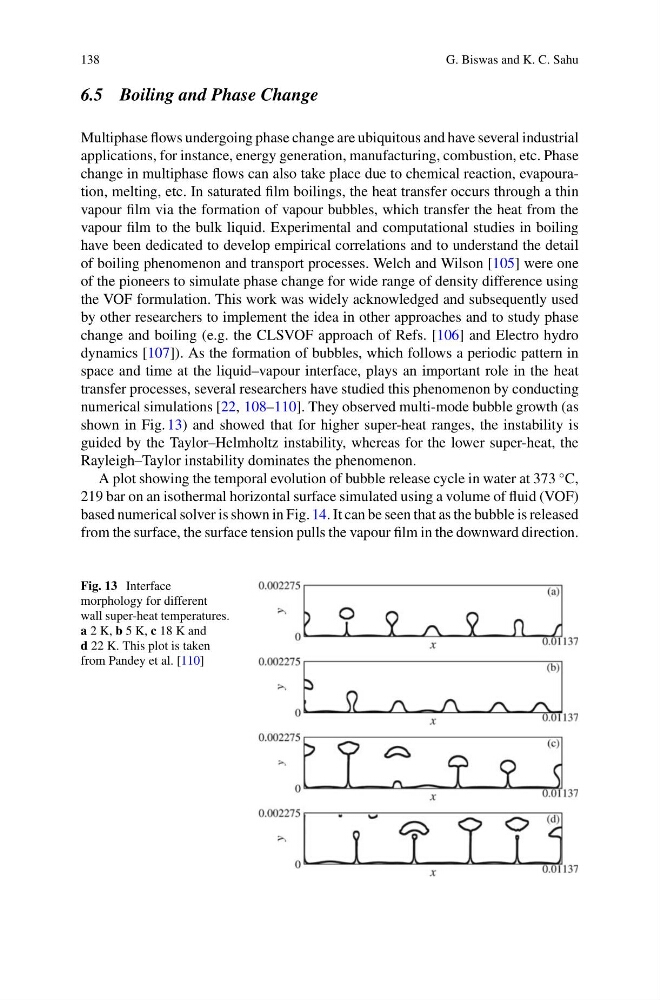
numerical simulations [22, 108–110]. They observed multi-mode bubble growth (as
shown in Fig. 13) and showed that for higher super-heat ranges, the instability is
guided by the Taylor–Helmholtz instability, whereas for the lower super-heat, the
Rayleigh–Taylor instability dominates the phenomenon.
A plot showing the temporal evolution of bubble release cycle in water at 373
◦ C,
219 bar on an isothermal horizontal surface simulated using a volume of fluid (VOF)
based numerical solver is shown in Fig. 14. It can be seen that as the bubble is released
from the surface, the surface tension pulls the vapour film in the downward direction.
Fig. 13 Interface
morphology for different
wall super-heat temperatures.
a 2 K, b 5 K, c 18 K and
d 22 K. This plot is taken
from Pandey et al. [110]
G. Biswas and K. C. Sahu
6.5 Boiling and Phase Change
Multiphase flows undergoing phase change are ubiquitous and have several industrial
applications, for instance, energy generation, manufacturing, combustion, etc. Phase
change in multiphase flows can also take place due to chemical reaction, evapouration, melting, etc. In saturated film boilings, the heat transfer occurs through a thin
vapour film via the formation of vapour bubbles, which transfer the heat from the
vapour film to the bulk liquid. Experimental and computational studies in boiling
have been dedicated to develop empirical correlations and to understand the detail
of boiling phenomenon and transport processes. Welch and Wilson [105] were one
of the pioneers to simulate phase change for wide range of density difference using
the VOF formulation. This work was widely acknowledged and subsequently used
by other researchers to implement the idea in other approaches and to study phase
change and boiling (e.g. the CLSVOF approach of Refs. [106] and Electro hydro
dynamics [107]). As the formation of bubbles, which follows a periodic pattern in
space and time at the liquid–vapour interface, plays an important role in the heat
transfer processes, several researchers have studied this phenomenon by conducting
numerical simulations [22, 108–110]. They observed multi-mode bubble growth (as
shown in Fig. 13) and showed that for higher super-heat ranges, the instability is
guided by the Taylor–Helmholtz instability, whereas for the lower super-heat, the
Rayleigh–Taylor instability dominates the phenomenon.
A plot showing the temporal evolution of bubble release cycle in water at 373
◦ C,
219 bar on an isothermal horizontal surface simulated using a volume of fluid (VOF)
based numerical solver is shown in Fig. 14. It can be seen that as the bubble is released
from the surface, the surface tension pulls the vapour film in the downward direction.
Fig. 13 Interface
morphology for different
wall super-heat temperatures.
a 2 K, b 5 K, c 18 K and
d 22 K. This plot is taken
from Pandey et al. [110]