

130
G. Biswas and K. C. Sahu
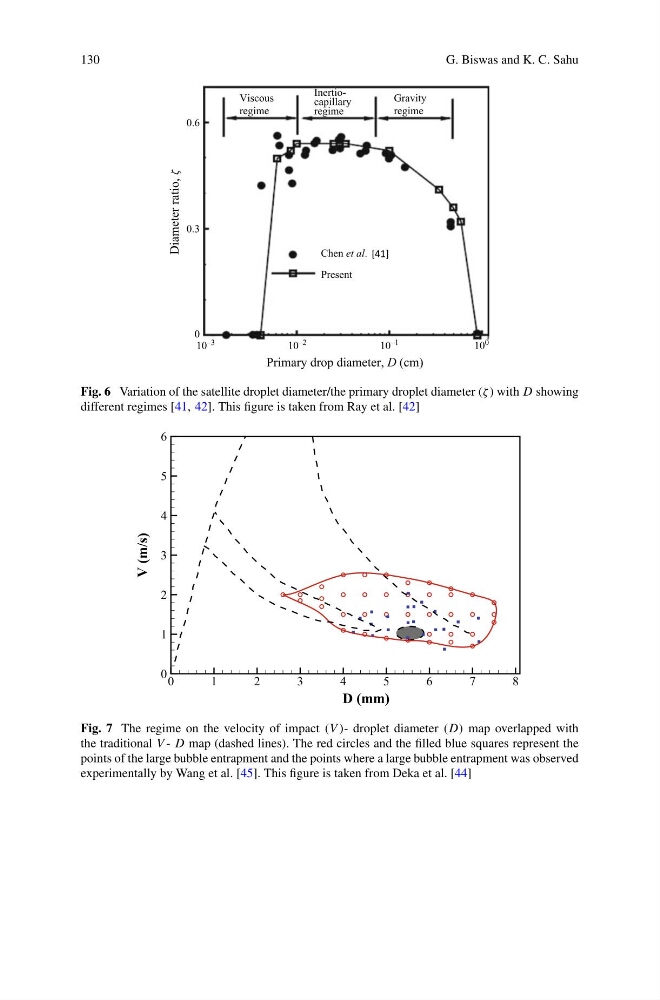
Fig. 6 Variation of the satellite droplet diameter/the primary droplet diameter (ζ ) with D showing
different regimes [41, 42]. This figure is taken from Ray et al. [42]
Fig. 7 The regime on the velocity of impact (V )- droplet diameter (D) map overlapped with
the traditional V - D map (dashed lines). The red circles and the filled blue squares represent the
points of the large bubble entrapment and the points where a large bubble entrapment was observed
experimentally by Wang et al. [45]. This figure is taken from Deka et al. [44]
G. Biswas and K. C. Sahu
Fig. 6 Variation of the satellite droplet diameter/the primary droplet diameter (ζ ) with D showing
different regimes [41, 42]. This figure is taken from Ray et al. [42]
Fig. 7 The regime on the velocity of impact (V )- droplet diameter (D) map overlapped with
the traditional V - D map (dashed lines). The red circles and the filled blue squares represent the
points of the large bubble entrapment and the points where a large bubble entrapment was observed
experimentally by Wang et al. [45]. This figure is taken from Deka et al. [44]