

568
R. B. Pachori and V. Gupta
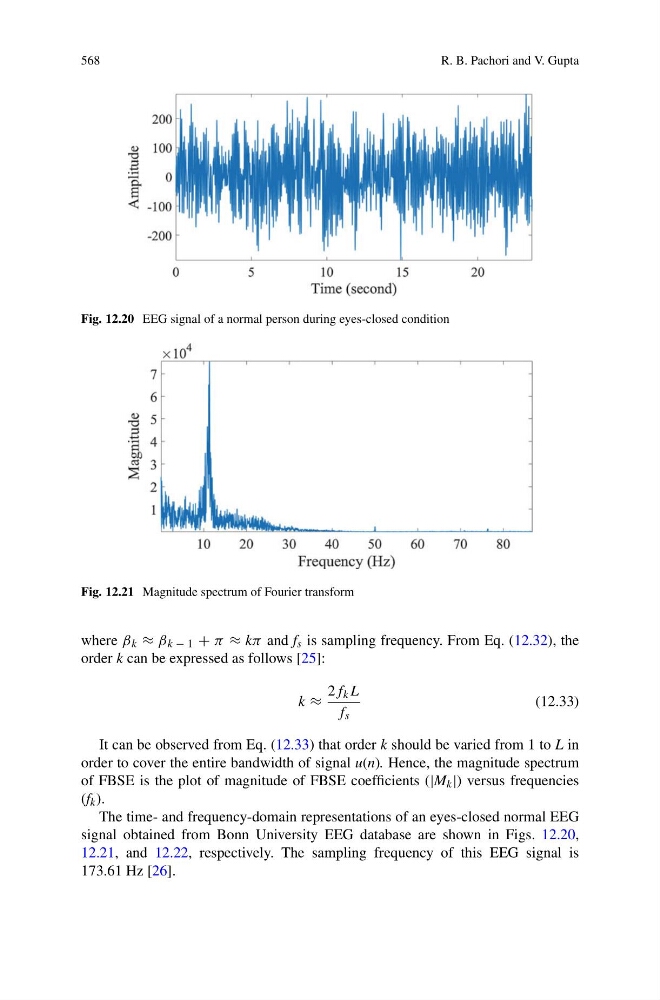
Fig. 12.20 EEG signal of a normal person during eyes-closed condition
Fig. 12.21 Magnitude spectrum of Fourier transform
where β k ≈ β k − 1 + π ≈ kπ and f s is sampling frequency. From Eq. (12.32), the
order k can be expressed as follows [25]:
k ≈
2f k L
f s
(12.33)
It can be observed from Eq. (12.33) that order k should be varied from 1 to L in
order to cover the entire bandwidth of signal u(n). Hence, the magnitude spectrum
of FBSE is the plot of magnitude of FBSE coefficients (|M k |) versus frequencies
(f k ).
The time- and frequency-domain representations of an eyes-closed normal EEG
signal obtained from Bonn University EEG database are shown in Figs. 12.20,
12.21, and 12.22, respectively. The sampling frequency of this EEG signal is
173.61 Hz [26].
R. B. Pachori and V. Gupta
Fig. 12.20 EEG signal of a normal person during eyes-closed condition
Fig. 12.21 Magnitude spectrum of Fourier transform
where β k ≈ β k − 1 + π ≈ kπ and f s is sampling frequency. From Eq. (12.32), the
order k can be expressed as follows [25]:
k ≈
2f k L
f s
(12.33)
It can be observed from Eq. (12.33) that order k should be varied from 1 to L in
order to cover the entire bandwidth of signal u(n). Hence, the magnitude spectrum
of FBSE is the plot of magnitude of FBSE coefficients (|M k |) versus frequencies
(f k ).
The time- and frequency-domain representations of an eyes-closed normal EEG
signal obtained from Bonn University EEG database are shown in Figs. 12.20,
12.21, and 12.22, respectively. The sampling frequency of this EEG signal is
173.61 Hz [26].