

286
F. Firouzi et al.
1
X 2
If Y=1
1
X 2
If Y=0
0
0
Fig. 5.38 Cost function of logistic regression
H1
H2
H3
X
Y
A
B
C
X
Y
Support Vectors
a)
b)
This margin should
be maximized
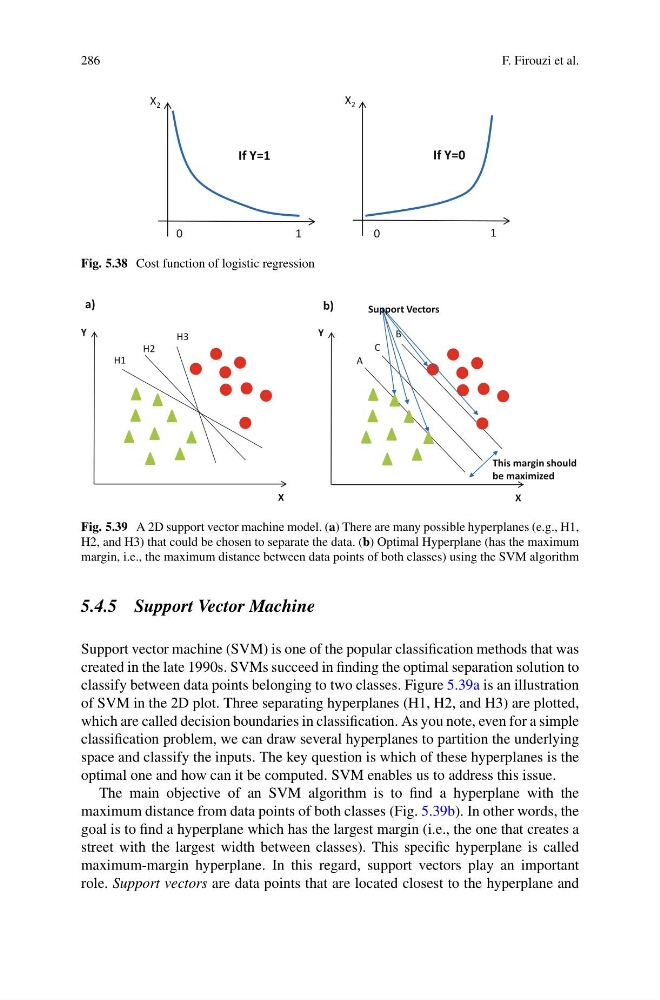
Fig. 5.39 A 2D support vector machine model. (a) There are many possible hyperplanes (e.g., H1,
H2, and H3) that could be chosen to separate the data. (b) Optimal Hyperplane (has the maximum
margin, i.e., the maximum distance between data points of both classes) using the SVM algorithm
5.4.5 Support Vector Machine
Support vector machine (SVM) is one of the popular classification methods that was
created in the late 1990s. SVMs succeed in finding the optimal separation solution to
classify between data points belonging to two classes. Figure 5.39a is an illustration
of SVM in the 2D plot. Three separating hyperplanes (H1, H2, and H3) are plotted,
which are called decision boundaries in classification. As you note, even for a simple
classification problem, we can draw several hyperplanes to partition the underlying
space and classify the inputs. The key question is which of these hyperplanes is the
optimal one and how can it be computed. SVM enables us to address this issue.
The main objective of an SVM algorithm is to find a hyperplane with the
maximum distance from data points of both classes (Fig. 5.39b). In other words, the
goal is to find a hyperplane which has the largest margin (i.e., the one that creates a
street with the largest width between classes). This specific hyperplane is called
maximum-margin hyperplane. In this regard, support vectors play an important
role. Support vectors are data points that are located closest to the hyperplane and
F. Firouzi et al.
1
X 2
If Y=1
1
X 2
If Y=0
0
0
Fig. 5.38 Cost function of logistic regression
H1
H2
H3
X
Y
A
B
C
X
Y
Support Vectors
a)
b)
This margin should
be maximized
Fig. 5.39 A 2D support vector machine model. (a) There are many possible hyperplanes (e.g., H1,
H2, and H3) that could be chosen to separate the data. (b) Optimal Hyperplane (has the maximum
margin, i.e., the maximum distance between data points of both classes) using the SVM algorithm
5.4.5 Support Vector Machine
Support vector machine (SVM) is one of the popular classification methods that was
created in the late 1990s. SVMs succeed in finding the optimal separation solution to
classify between data points belonging to two classes. Figure 5.39a is an illustration
of SVM in the 2D plot. Three separating hyperplanes (H1, H2, and H3) are plotted,
which are called decision boundaries in classification. As you note, even for a simple
classification problem, we can draw several hyperplanes to partition the underlying
space and classify the inputs. The key question is which of these hyperplanes is the
optimal one and how can it be computed. SVM enables us to address this issue.
The main objective of an SVM algorithm is to find a hyperplane with the
maximum distance from data points of both classes (Fig. 5.39b). In other words, the
goal is to find a hyperplane which has the largest margin (i.e., the one that creates a
street with the largest width between classes). This specific hyperplane is called
maximum-margin hyperplane. In this regard, support vectors play an important
role. Support vectors are data points that are located closest to the hyperplane and