

340
W. Pfleging et al.
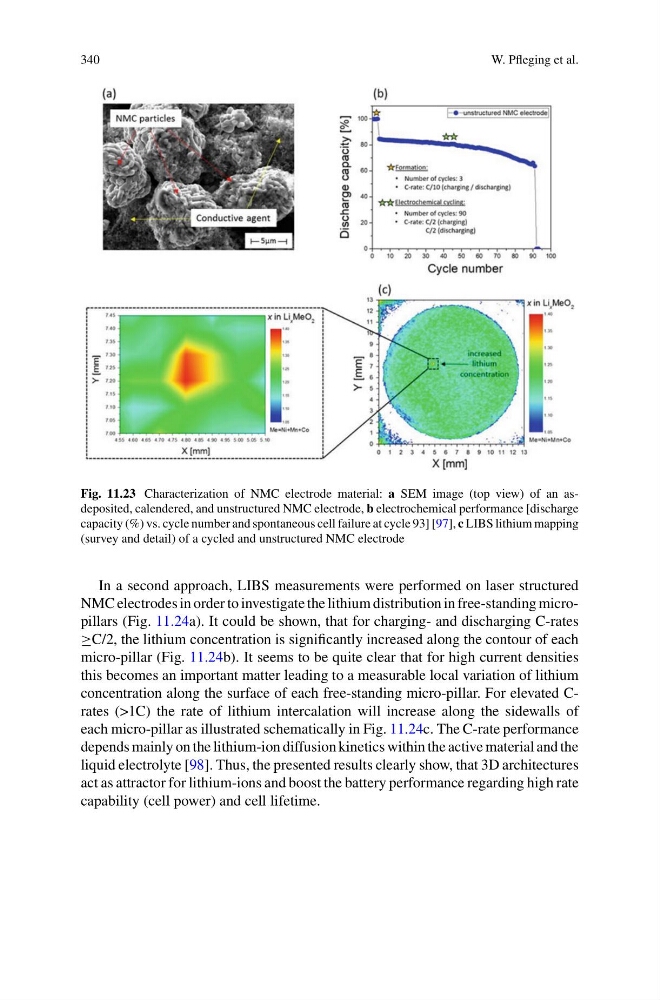
Fig. 11.23 Characterization of NMC electrode material: a SEM image (top view) of an asdeposited, calendered, and unstructured NMC electrode, b electrochemical performance [discharge
capacity (%) vs. cycle number and spontaneous cell failure at cycle 93] [97], c LIBS lithium mapping
(survey and detail) of a cycled and unstructured NMC electrode
In a second approach, LIBS measurements were performed on laser structured
NMC electrodes in order to investigate the lithium distribution in free-standing micropillars (Fig. 11.24a). It could be shown, that for charging- and discharging C-rates
≥C/2, the lithium concentration is significantly increased along the contour of each
micro-pillar (Fig. 11.24b). It seems to be quite clear that for high current densities
this becomes an important matter leading to a measurable local variation of lithium
concentration along the surface of each free-standing micro-pillar. For elevated Crates (>1C) the rate of lithium intercalation will increase along the sidewalls of
each micro-pillar as illustrated schematically in Fig. 11.24c. The C-rate performance
depends mainly on the lithium-ion diffusion kinetics within the active material and the
liquid electrolyte [98]. Thus, the presented results clearly show, that 3D architectures
act as attractor for lithium-ions and boost the battery performance regarding high rate
capability (cell power) and cell lifetime.
W. Pfleging et al.
Fig. 11.23 Characterization of NMC electrode material: a SEM image (top view) of an asdeposited, calendered, and unstructured NMC electrode, b electrochemical performance [discharge
capacity (%) vs. cycle number and spontaneous cell failure at cycle 93] [97], c LIBS lithium mapping
(survey and detail) of a cycled and unstructured NMC electrode
In a second approach, LIBS measurements were performed on laser structured
NMC electrodes in order to investigate the lithium distribution in free-standing micropillars (Fig. 11.24a). It could be shown, that for charging- and discharging C-rates
≥C/2, the lithium concentration is significantly increased along the contour of each
micro-pillar (Fig. 11.24b). It seems to be quite clear that for high current densities
this becomes an important matter leading to a measurable local variation of lithium
concentration along the surface of each free-standing micro-pillar. For elevated Crates (>1C) the rate of lithium intercalation will increase along the sidewalls of
each micro-pillar as illustrated schematically in Fig. 11.24c. The C-rate performance
depends mainly on the lithium-ion diffusion kinetics within the active material and the
liquid electrolyte [98]. Thus, the presented results clearly show, that 3D architectures
act as attractor for lithium-ions and boost the battery performance regarding high rate
capability (cell power) and cell lifetime.