

11 Lithium-Ion Battery—3D Micro-/Nano-Structuring, Modification …
329
Table 11.1 Li-ion diffusion coefficients measured in cells with unstructured and laser structured
materials
Method
Diffusion coefficient (cm s 2 )
No structure
Laser structured
GITT
1.57 × 10 –12
7.13 × 10 –12
CV
1.54 × 10 –12 (charge) 1.11 × 10 –12
(discharge)
7.4 × 10 –12 (charge) 4.0 × 10 –12
(discharge)
well, especially when the charge process for CV measurements is considered, and are
consistent with the already determined diffusion coefficient for such active material.
The values of the diffusion coefficients are in the range given by previous studies
[64], which are influenced by the measurement parameters, voltage range, electrolyte
properties, etc. However, the goal of this work was to determine relative values with
respect to the specific design characteristics of reference and laser-cells.
The laser-cells seem to have generally a higher kinetic performance, independent
of the cathode material. This observation was made on cells with structured LiFePO 4
[65], for which the difference in diffusion coefficient was about one order of magnitude. The corresponding 3D microstructures were generated with an ablation depth
of 39 μm down to the current collector.
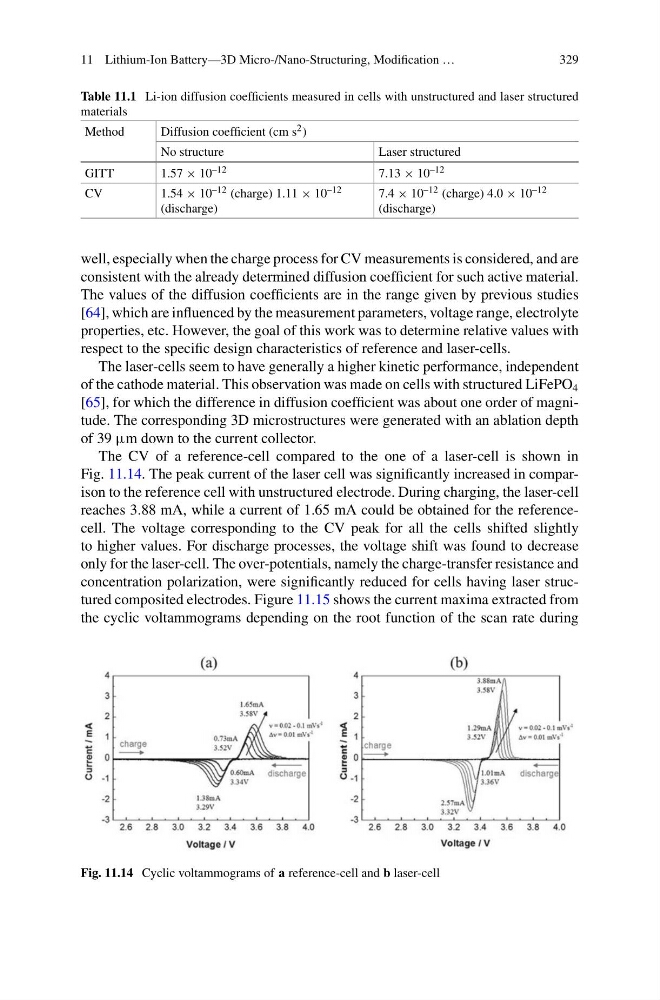
The CV of a reference-cell compared to the one of a laser-cell is shown in
Fig. 11.14. The peak current of the laser cell was significantly increased in comparison to the reference cell with unstructured electrode. During charging, the laser-cell
reaches 3.88 mA, while a current of 1.65 mA could be obtained for the referencecell. The voltage corresponding to the CV peak for all the cells shifted slightly
to higher values. For discharge processes, the voltage shift was found to decrease
only for the laser-cell. The over-potentials, namely the charge-transfer resistance and
concentration polarization, were significantly reduced for cells having laser structured composited electrodes. Figure 11.15 shows the current maxima extracted from
the cyclic voltammograms depending on the root function of the scan rate during
Fig. 11.14 Cyclic voltammograms of a reference-cell and b laser-cell
329
Table 11.1 Li-ion diffusion coefficients measured in cells with unstructured and laser structured
materials
Method
Diffusion coefficient (cm s 2 )
No structure
Laser structured
GITT
1.57 × 10 –12
7.13 × 10 –12
CV
1.54 × 10 –12 (charge) 1.11 × 10 –12
(discharge)
7.4 × 10 –12 (charge) 4.0 × 10 –12
(discharge)
well, especially when the charge process for CV measurements is considered, and are
consistent with the already determined diffusion coefficient for such active material.
The values of the diffusion coefficients are in the range given by previous studies
[64], which are influenced by the measurement parameters, voltage range, electrolyte
properties, etc. However, the goal of this work was to determine relative values with
respect to the specific design characteristics of reference and laser-cells.
The laser-cells seem to have generally a higher kinetic performance, independent
of the cathode material. This observation was made on cells with structured LiFePO 4
[65], for which the difference in diffusion coefficient was about one order of magnitude. The corresponding 3D microstructures were generated with an ablation depth
of 39 μm down to the current collector.
The CV of a reference-cell compared to the one of a laser-cell is shown in
Fig. 11.14. The peak current of the laser cell was significantly increased in comparison to the reference cell with unstructured electrode. During charging, the laser-cell
reaches 3.88 mA, while a current of 1.65 mA could be obtained for the referencecell. The voltage corresponding to the CV peak for all the cells shifted slightly
to higher values. For discharge processes, the voltage shift was found to decrease
only for the laser-cell. The over-potentials, namely the charge-transfer resistance and
concentration polarization, were significantly reduced for cells having laser structured composited electrodes. Figure 11.15 shows the current maxima extracted from
the cyclic voltammograms depending on the root function of the scan rate during
Fig. 11.14 Cyclic voltammograms of a reference-cell and b laser-cell