

330
W. Pfleging et al.
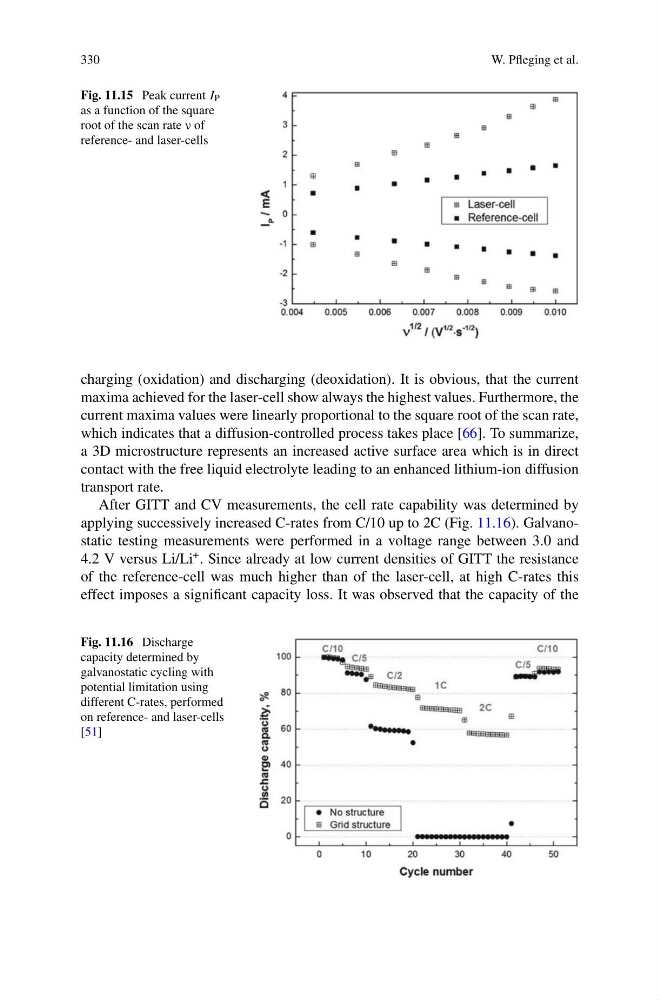
Fig. 11.15 Peak current I P
as a function of the square
root of the scan rate ν of
reference- and laser-cells
charging (oxidation) and discharging (deoxidation). It is obvious, that the current
maxima achieved for the laser-cell show always the highest values. Furthermore, the
current maxima values were linearly proportional to the square root of the scan rate,
which indicates that a diffusion-controlled process takes place [66]. To summarize,
a 3D microstructure represents an increased active surface area which is in direct
contact with the free liquid electrolyte leading to an enhanced lithium-ion diffusion
transport rate.
After GITT and CV measurements, the cell rate capability was determined by
applying successively increased C-rates from C/10 up to 2C (Fig. 11.16). Galvanostatic testing measurements were performed in a voltage range between 3.0 and
4.2 V versus Li/Li
+ . Since already at low current densities of GITT the resistance
of the reference-cell was much higher than of the laser-cell, at high C-rates this
effect imposes a significant capacity loss. It was observed that the capacity of the
Fig. 11.16 Discharge
capacity determined by
galvanostatic cycling with
potential limitation using
different C-rates, performed
on reference- and laser-cells
[51]
W. Pfleging et al.
Fig. 11.15 Peak current I P
as a function of the square
root of the scan rate ν of
reference- and laser-cells
charging (oxidation) and discharging (deoxidation). It is obvious, that the current
maxima achieved for the laser-cell show always the highest values. Furthermore, the
current maxima values were linearly proportional to the square root of the scan rate,
which indicates that a diffusion-controlled process takes place [66]. To summarize,
a 3D microstructure represents an increased active surface area which is in direct
contact with the free liquid electrolyte leading to an enhanced lithium-ion diffusion
transport rate.
After GITT and CV measurements, the cell rate capability was determined by
applying successively increased C-rates from C/10 up to 2C (Fig. 11.16). Galvanostatic testing measurements were performed in a voltage range between 3.0 and
4.2 V versus Li/Li
+ . Since already at low current densities of GITT the resistance
of the reference-cell was much higher than of the laser-cell, at high C-rates this
effect imposes a significant capacity loss. It was observed that the capacity of the
Fig. 11.16 Discharge
capacity determined by
galvanostatic cycling with
potential limitation using
different C-rates, performed
on reference- and laser-cells
[51]