

324
W. Pfleging et al.
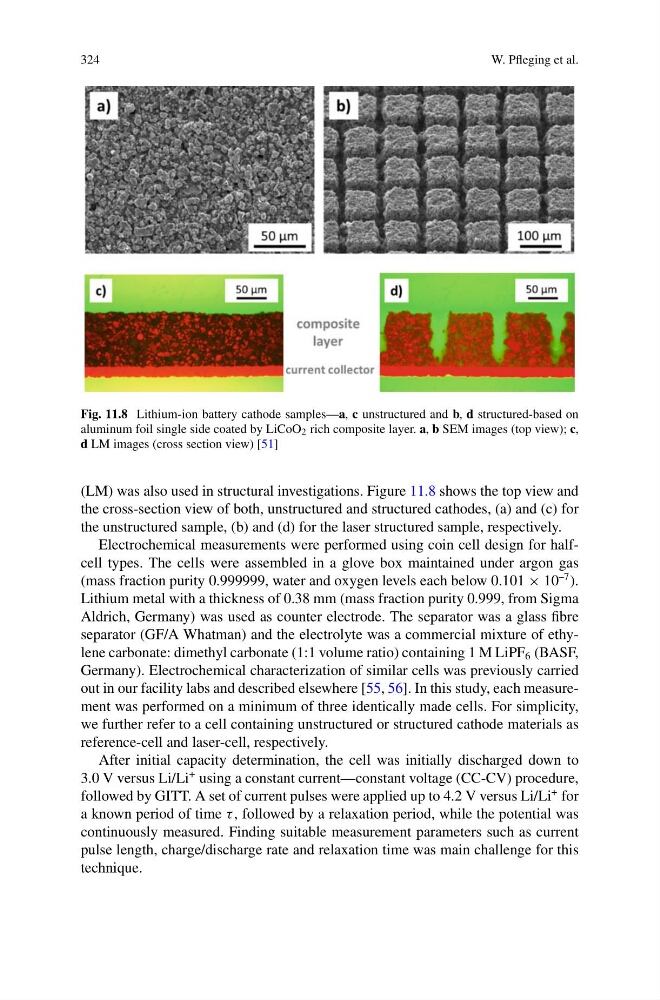
Fig. 11.8 Lithium-ion battery cathode samples—a, c unstructured and b, d structured-based on
aluminum foil single side coated by LiCoO 2 rich composite layer. a, b SEM images (top view); c,
d LM images (cross section view) [51]
(LM) was also used in structural investigations. Figure 11.8 shows the top view and
the cross-section view of both, unstructured and structured cathodes, (a) and (c) for
the unstructured sample, (b) and (d) for the laser structured sample, respectively.
Electrochemical measurements were performed using coin cell design for halfcell types. The cells were assembled in a glove box maintained under argon gas
(mass fraction purity 0.999999, water and oxygen levels each below 0.101 × 10
–7 ).
Lithium metal with a thickness of 0.38 mm (mass fraction purity 0.999, from Sigma
Aldrich, Germany) was used as counter electrode. The separator was a glass fibre
separator (GF/A Whatman) and the electrolyte was a commercial mixture of ethylene carbonate: dimethyl carbonate (1:1 volume ratio) containing 1 M LiPF 6 (BASF,
Germany). Electrochemical characterization of similar cells was previously carried
out in our facility labs and described elsewhere [55, 56]. In this study, each measurement was performed on a minimum of three identically made cells. For simplicity,
we further refer to a cell containing unstructured or structured cathode materials as
reference-cell and laser-cell, respectively.
After initial capacity determination, the cell was initially discharged down to
3.0 V versus Li/Li
+ using a constant current—constant voltage (CC-CV) procedure,
followed by GITT. A set of current pulses were applied up to 4.2 V versus Li/Li
+ for
a known period of time τ , followed by a relaxation period, while the potential was
continuously measured. Finding suitable measurement parameters such as current
pulse length, charge/discharge rate and relaxation time was main challenge for this
technique.
W. Pfleging et al.
Fig. 11.8 Lithium-ion battery cathode samples—a, c unstructured and b, d structured-based on
aluminum foil single side coated by LiCoO 2 rich composite layer. a, b SEM images (top view); c,
d LM images (cross section view) [51]
(LM) was also used in structural investigations. Figure 11.8 shows the top view and
the cross-section view of both, unstructured and structured cathodes, (a) and (c) for
the unstructured sample, (b) and (d) for the laser structured sample, respectively.
Electrochemical measurements were performed using coin cell design for halfcell types. The cells were assembled in a glove box maintained under argon gas
(mass fraction purity 0.999999, water and oxygen levels each below 0.101 × 10
–7 ).
Lithium metal with a thickness of 0.38 mm (mass fraction purity 0.999, from Sigma
Aldrich, Germany) was used as counter electrode. The separator was a glass fibre
separator (GF/A Whatman) and the electrolyte was a commercial mixture of ethylene carbonate: dimethyl carbonate (1:1 volume ratio) containing 1 M LiPF 6 (BASF,
Germany). Electrochemical characterization of similar cells was previously carried
out in our facility labs and described elsewhere [55, 56]. In this study, each measurement was performed on a minimum of three identically made cells. For simplicity,
we further refer to a cell containing unstructured or structured cathode materials as
reference-cell and laser-cell, respectively.
After initial capacity determination, the cell was initially discharged down to
3.0 V versus Li/Li
+ using a constant current—constant voltage (CC-CV) procedure,
followed by GITT. A set of current pulses were applied up to 4.2 V versus Li/Li
+ for
a known period of time τ , followed by a relaxation period, while the potential was
continuously measured. Finding suitable measurement parameters such as current
pulse length, charge/discharge rate and relaxation time was main challenge for this
technique.