

5 Dry Laser Peening: Ultrashort Pulsed Laser Peening …
177
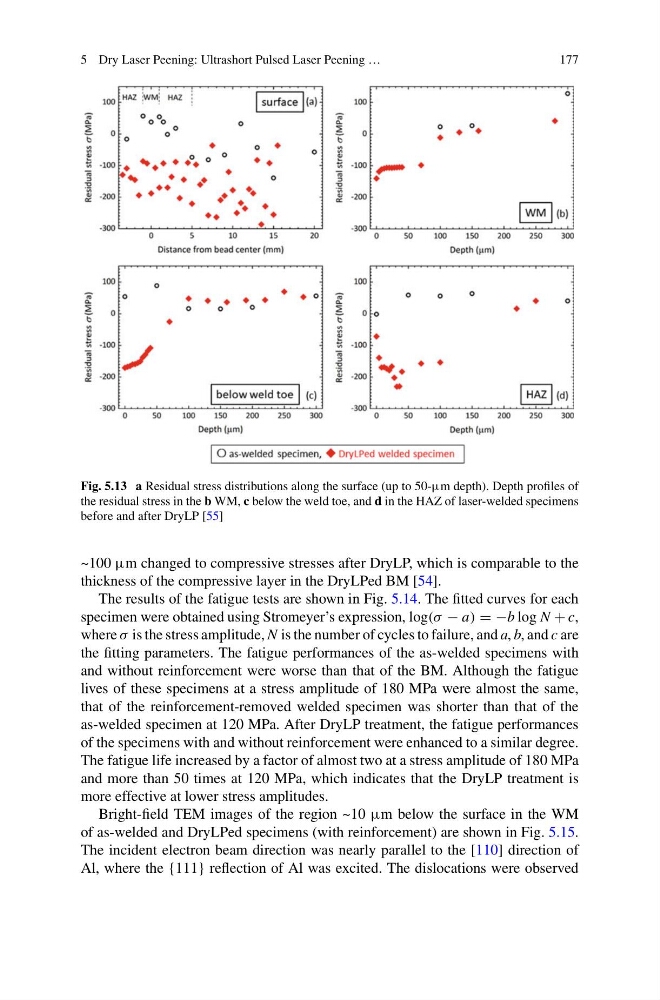
Fig. 5.13 a Residual stress distributions along the surface (up to 50-μm depth). Depth profiles of
the residual stress in the b WM, c below the weld toe, and d in the HAZ of laser-welded specimens
before and after DryLP [55]
~100 μm changed to compressive stresses after DryLP, which is comparable to the
thickness of the compressive layer in the DryLPed BM [54].
The results of the fatigue tests are shown in Fig. 5.14. The fitted curves for each
specimen were obtained using Stromeyer’s expression, log(σ − a) = −b log N + c,
where σ is the stress amplitude, N is the number of cycles to failure, and a, b, and c are
the fitting parameters. The fatigue performances of the as-welded specimens with
and without reinforcement were worse than that of the BM. Although the fatigue
lives of these specimens at a stress amplitude of 180 MPa were almost the same,
that of the reinforcement-removed welded specimen was shorter than that of the
as-welded specimen at 120 MPa. After DryLP treatment, the fatigue performances
of the specimens with and without reinforcement were enhanced to a similar degree.
The fatigue life increased by a factor of almost two at a stress amplitude of 180 MPa
and more than 50 times at 120 MPa, which indicates that the DryLP treatment is
more effective at lower stress amplitudes.
Bright-field TEM images of the region ~10 μm below the surface in the WM
of as-welded and DryLPed specimens (with reinforcement) are shown in Fig. 5.15.
The incident electron beam direction was nearly parallel to the [110] direction of
Al, where the {111} reflection of Al was excited. The dislocations were observed
177
Fig. 5.13 a Residual stress distributions along the surface (up to 50-μm depth). Depth profiles of
the residual stress in the b WM, c below the weld toe, and d in the HAZ of laser-welded specimens
before and after DryLP [55]
~100 μm changed to compressive stresses after DryLP, which is comparable to the
thickness of the compressive layer in the DryLPed BM [54].
The results of the fatigue tests are shown in Fig. 5.14. The fitted curves for each
specimen were obtained using Stromeyer’s expression, log(σ − a) = −b log N + c,
where σ is the stress amplitude, N is the number of cycles to failure, and a, b, and c are
the fitting parameters. The fatigue performances of the as-welded specimens with
and without reinforcement were worse than that of the BM. Although the fatigue
lives of these specimens at a stress amplitude of 180 MPa were almost the same,
that of the reinforcement-removed welded specimen was shorter than that of the
as-welded specimen at 120 MPa. After DryLP treatment, the fatigue performances
of the specimens with and without reinforcement were enhanced to a similar degree.
The fatigue life increased by a factor of almost two at a stress amplitude of 180 MPa
and more than 50 times at 120 MPa, which indicates that the DryLP treatment is
more effective at lower stress amplitudes.
Bright-field TEM images of the region ~10 μm below the surface in the WM
of as-welded and DryLPed specimens (with reinforcement) are shown in Fig. 5.15.
The incident electron beam direction was nearly parallel to the [110] direction of
Al, where the {111} reflection of Al was excited. The dislocations were observed