

178
T. Sano
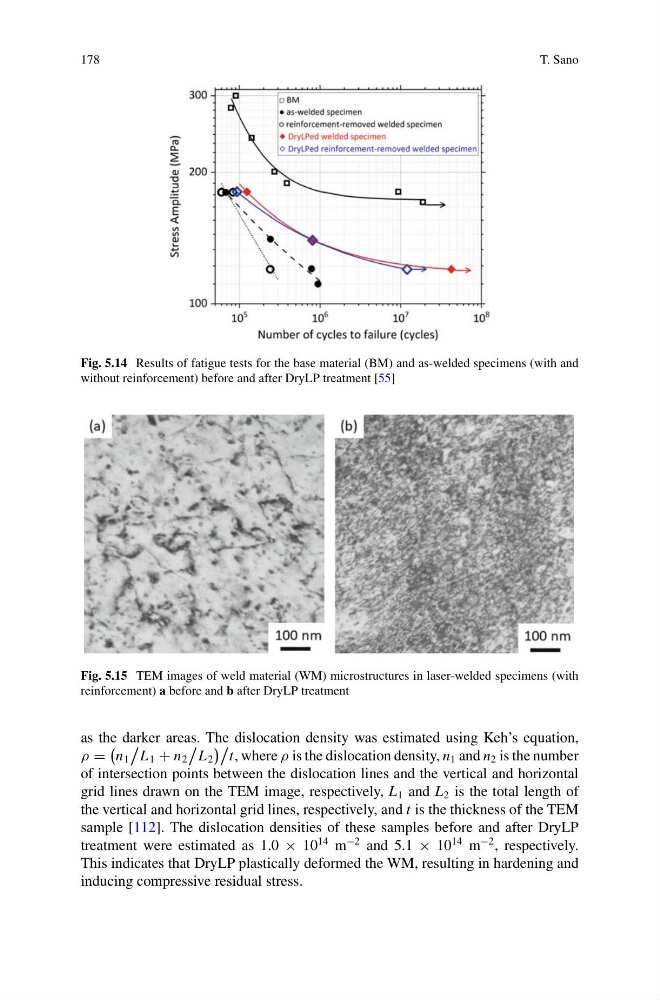
Fig. 5.14 Results of fatigue tests for the base material (BM) and as-welded specimens (with and
without reinforcement) before and after DryLP treatment [55]
Fig. 5.15 TEM images of weld material (WM) microstructures in laser-welded specimens (with
reinforcement) a before and b after DryLP treatment
as the darker areas. The dislocation density was estimated using Keh’s equation,
ρ =
n 1
L 1 + n 2
L 2
t, where ρ is the dislocation density, n 1 and n 2 is the number
of intersection points between the dislocation lines and the vertical and horizontal
grid lines drawn on the TEM image, respectively, L 1 and L 2 is the total length of
the vertical and horizontal grid lines, respectively, and t is the thickness of the TEM
sample [112]. The dislocation densities of these samples before and after DryLP
treatment were estimated as 1.0 × 10
14 m
−2 and 5.1 × 10
14 m
−2 , respectively.
This indicates that DryLP plastically deformed the WM, resulting in hardening and
inducing compressive residual stress.
T. Sano
Fig. 5.14 Results of fatigue tests for the base material (BM) and as-welded specimens (with and
without reinforcement) before and after DryLP treatment [55]
Fig. 5.15 TEM images of weld material (WM) microstructures in laser-welded specimens (with
reinforcement) a before and b after DryLP treatment
as the darker areas. The dislocation density was estimated using Keh’s equation,
ρ =
n 1
L 1 + n 2
L 2
t, where ρ is the dislocation density, n 1 and n 2 is the number
of intersection points between the dislocation lines and the vertical and horizontal
grid lines drawn on the TEM image, respectively, L 1 and L 2 is the total length of
the vertical and horizontal grid lines, respectively, and t is the thickness of the TEM
sample [112]. The dislocation densities of these samples before and after DryLP
treatment were estimated as 1.0 × 10
14 m
−2 and 5.1 × 10
14 m
−2 , respectively.
This indicates that DryLP plastically deformed the WM, resulting in hardening and
inducing compressive residual stress.