

5 Dry Laser Peening: Ultrashort Pulsed Laser Peening …
175
The microstructures were observed to estimate dislocation densities in the specimens using a transmission electron microscopy (TEM; JEOL JEM-2010, Japan)
with an acceleration voltage of 200 kV. For TEM observations, a small piece of the
cross-section was thinned using a 30-keV-focused Ga-ion beam (Hitachi, FB-2000A,
Japan).
5.3.3 Results
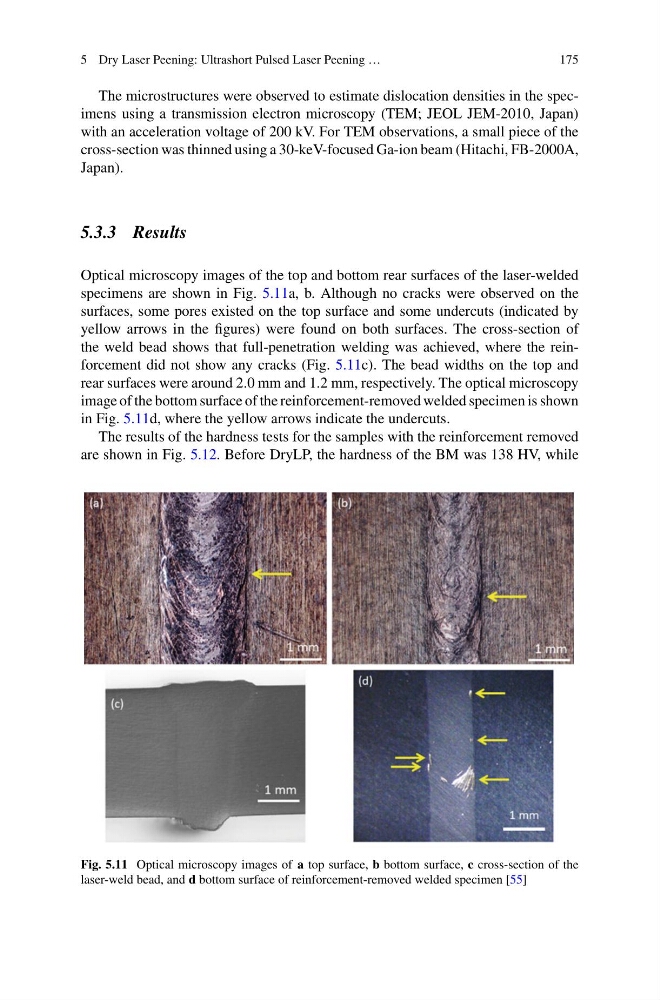
Optical microscopy images of the top and bottom rear surfaces of the laser-welded
specimens are shown in Fig. 5.11a, b. Although no cracks were observed on the
surfaces, some pores existed on the top surface and some undercuts (indicated by
yellow arrows in the figures) were found on both surfaces. The cross-section of
the weld bead shows that full-penetration welding was achieved, where the reinforcement did not show any cracks (Fig. 5.11c). The bead widths on the top and
rear surfaces were around 2.0 mm and 1.2 mm, respectively. The optical microscopy
image of the bottom surface of the reinforcement-removed welded specimen is shown
in Fig. 5.11d, where the yellow arrows indicate the undercuts.
The results of the hardness tests for the samples with the reinforcement removed
are shown in Fig. 5.12. Before DryLP, the hardness of the BM was 138 HV, while
Fig. 5.11 Optical microscopy images of a top surface, b bottom surface, c cross-section of the
laser-weld bead, and d bottom surface of reinforcement-removed welded specimen [55]
175
The microstructures were observed to estimate dislocation densities in the specimens using a transmission electron microscopy (TEM; JEOL JEM-2010, Japan)
with an acceleration voltage of 200 kV. For TEM observations, a small piece of the
cross-section was thinned using a 30-keV-focused Ga-ion beam (Hitachi, FB-2000A,
Japan).
5.3.3 Results
Optical microscopy images of the top and bottom rear surfaces of the laser-welded
specimens are shown in Fig. 5.11a, b. Although no cracks were observed on the
surfaces, some pores existed on the top surface and some undercuts (indicated by
yellow arrows in the figures) were found on both surfaces. The cross-section of
the weld bead shows that full-penetration welding was achieved, where the reinforcement did not show any cracks (Fig. 5.11c). The bead widths on the top and
rear surfaces were around 2.0 mm and 1.2 mm, respectively. The optical microscopy
image of the bottom surface of the reinforcement-removed welded specimen is shown
in Fig. 5.11d, where the yellow arrows indicate the undercuts.
The results of the hardness tests for the samples with the reinforcement removed
are shown in Fig. 5.12. Before DryLP, the hardness of the BM was 138 HV, while
Fig. 5.11 Optical microscopy images of a top surface, b bottom surface, c cross-section of the
laser-weld bead, and d bottom surface of reinforcement-removed welded specimen [55]