

174
T. Sano
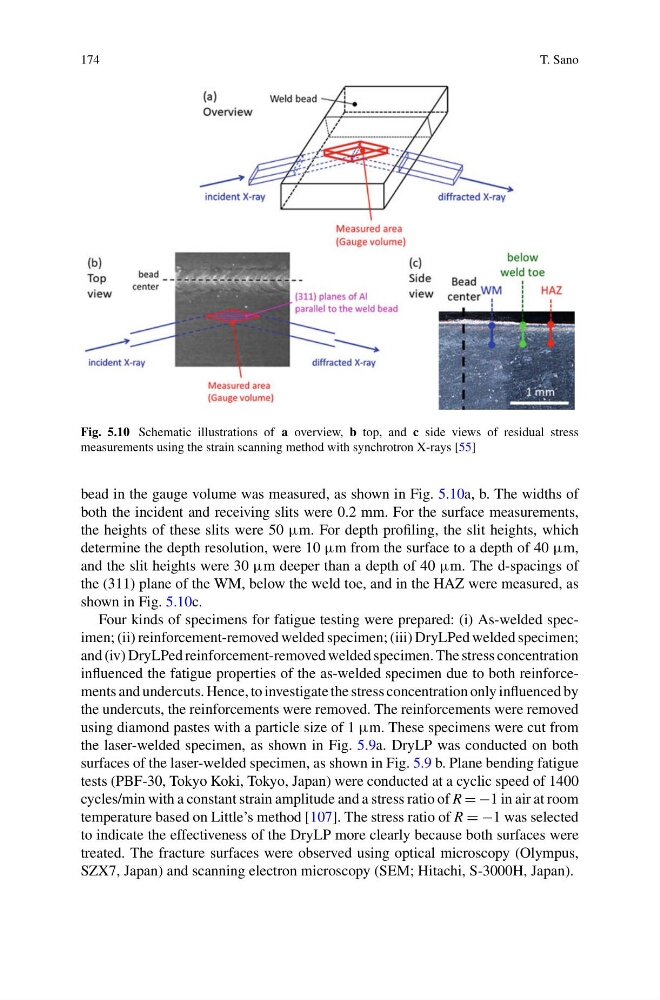
Fig. 5.10 Schematic illustrations of a overview, b top, and c side views of residual stress
measurements using the strain scanning method with synchrotron X-rays [55]
bead in the gauge volume was measured, as shown in Fig. 5.10a, b. The widths of
both the incident and receiving slits were 0.2 mm. For the surface measurements,
the heights of these slits were 50 μm. For depth profiling, the slit heights, which
determine the depth resolution, were 10 μm from the surface to a depth of 40 μm,
and the slit heights were 30 μm deeper than a depth of 40 μm. The d-spacings of
the (311) plane of the WM, below the weld toe, and in the HAZ were measured, as
shown in Fig. 5.10c.
Four kinds of specimens for fatigue testing were prepared: (i) As-welded specimen; (ii) reinforcement-removed welded specimen; (iii) DryLPed welded specimen;
and (iv) DryLPed reinforcement-removed welded specimen. The stress concentration
influenced the fatigue properties of the as-welded specimen due to both reinforcements and undercuts. Hence, to investigate the stress concentration only influenced by
the undercuts, the reinforcements were removed. The reinforcements were removed
using diamond pastes with a particle size of 1 μm. These specimens were cut from
the laser-welded specimen, as shown in Fig. 5.9a. DryLP was conducted on both
surfaces of the laser-welded specimen, as shown in Fig. 5.9 b. Plane bending fatigue
tests (PBF-30, Tokyo Koki, Tokyo, Japan) were conducted at a cyclic speed of 1400
cycles/min with a constant strain amplitude and a stress ratio of R = −1 in air at room
temperature based on Little’s method [107]. The stress ratio of R = −1 was selected
to indicate the effectiveness of the DryLP more clearly because both surfaces were
treated. The fracture surfaces were observed using optical microscopy (Olympus,
SZX7, Japan) and scanning electron microscopy (SEM; Hitachi, S-3000H, Japan).
T. Sano
Fig. 5.10 Schematic illustrations of a overview, b top, and c side views of residual stress
measurements using the strain scanning method with synchrotron X-rays [55]
bead in the gauge volume was measured, as shown in Fig. 5.10a, b. The widths of
both the incident and receiving slits were 0.2 mm. For the surface measurements,
the heights of these slits were 50 μm. For depth profiling, the slit heights, which
determine the depth resolution, were 10 μm from the surface to a depth of 40 μm,
and the slit heights were 30 μm deeper than a depth of 40 μm. The d-spacings of
the (311) plane of the WM, below the weld toe, and in the HAZ were measured, as
shown in Fig. 5.10c.
Four kinds of specimens for fatigue testing were prepared: (i) As-welded specimen; (ii) reinforcement-removed welded specimen; (iii) DryLPed welded specimen;
and (iv) DryLPed reinforcement-removed welded specimen. The stress concentration
influenced the fatigue properties of the as-welded specimen due to both reinforcements and undercuts. Hence, to investigate the stress concentration only influenced by
the undercuts, the reinforcements were removed. The reinforcements were removed
using diamond pastes with a particle size of 1 μm. These specimens were cut from
the laser-welded specimen, as shown in Fig. 5.9a. DryLP was conducted on both
surfaces of the laser-welded specimen, as shown in Fig. 5.9 b. Plane bending fatigue
tests (PBF-30, Tokyo Koki, Tokyo, Japan) were conducted at a cyclic speed of 1400
cycles/min with a constant strain amplitude and a stress ratio of R = −1 in air at room
temperature based on Little’s method [107]. The stress ratio of R = −1 was selected
to indicate the effectiveness of the DryLP more clearly because both surfaces were
treated. The fracture surfaces were observed using optical microscopy (Olympus,
SZX7, Japan) and scanning electron microscopy (SEM; Hitachi, S-3000H, Japan).