

5 Dry Laser Peening: Ultrashort Pulsed Laser Peening …
169
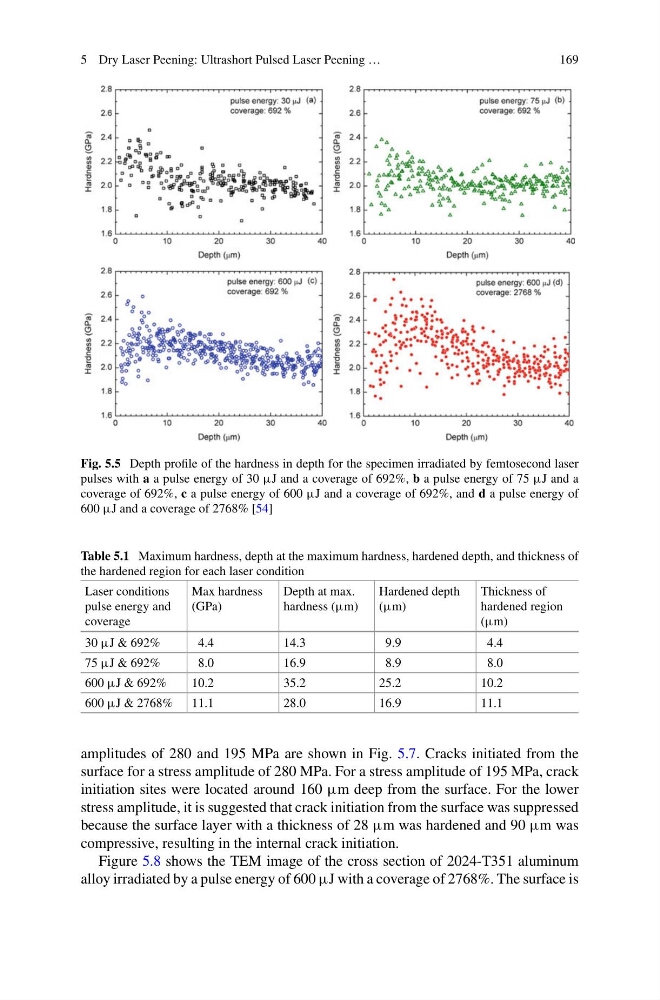
Fig. 5.5 Depth profile of the hardness in depth for the specimen irradiated by femtosecond laser
pulses with a a pulse energy of 30 μJ and a coverage of 692%, b a pulse energy of 75 μJ and a
coverage of 692%, c a pulse energy of 600 μJ and a coverage of 692%, and d a pulse energy of
600 μJ and a coverage of 2768% [54]
Table 5.1 Maximum hardness, depth at the maximum hardness, hardened depth, and thickness of
the hardened region for each laser condition
Laser conditions
pulse energy and
coverage
Max hardness
(GPa)
Depth at max.
hardness (μm)
Hardened depth
(μm)
Thickness of
hardened region
(μm)
30 μJ & 692%
4.4
14.3
9.9
4.4
75 μJ & 692%
8.0
16.9
8.9
8.0
600 μJ & 692%
10.2
35.2
25.2
10.2
600 μJ & 2768% 11.1
28.0
16.9
11.1
amplitudes of 280 and 195 MPa are shown in Fig. 5.7. Cracks initiated from the
surface for a stress amplitude of 280 MPa. For a stress amplitude of 195 MPa, crack
initiation sites were located around 160 μm deep from the surface. For the lower
stress amplitude, it is suggested that crack initiation from the surface was suppressed
because the surface layer with a thickness of 28 μm was hardened and 90 μm was
compressive, resulting in the internal crack initiation.
Figure 5.8 shows the TEM image of the cross section of 2024-T351 aluminum
alloy irradiated by a pulse energy of 600 μJ with a coverage of 2768%. The surface is
169
Fig. 5.5 Depth profile of the hardness in depth for the specimen irradiated by femtosecond laser
pulses with a a pulse energy of 30 μJ and a coverage of 692%, b a pulse energy of 75 μJ and a
coverage of 692%, c a pulse energy of 600 μJ and a coverage of 692%, and d a pulse energy of
600 μJ and a coverage of 2768% [54]
Table 5.1 Maximum hardness, depth at the maximum hardness, hardened depth, and thickness of
the hardened region for each laser condition
Laser conditions
pulse energy and
coverage
Max hardness
(GPa)
Depth at max.
hardness (μm)
Hardened depth
(μm)
Thickness of
hardened region
(μm)
30 μJ & 692%
4.4
14.3
9.9
4.4
75 μJ & 692%
8.0
16.9
8.9
8.0
600 μJ & 692%
10.2
35.2
25.2
10.2
600 μJ & 2768% 11.1
28.0
16.9
11.1
amplitudes of 280 and 195 MPa are shown in Fig. 5.7. Cracks initiated from the
surface for a stress amplitude of 280 MPa. For a stress amplitude of 195 MPa, crack
initiation sites were located around 160 μm deep from the surface. For the lower
stress amplitude, it is suggested that crack initiation from the surface was suppressed
because the surface layer with a thickness of 28 μm was hardened and 90 μm was
compressive, resulting in the internal crack initiation.
Figure 5.8 shows the TEM image of the cross section of 2024-T351 aluminum
alloy irradiated by a pulse energy of 600 μJ with a coverage of 2768%. The surface is