

168
T. Sano
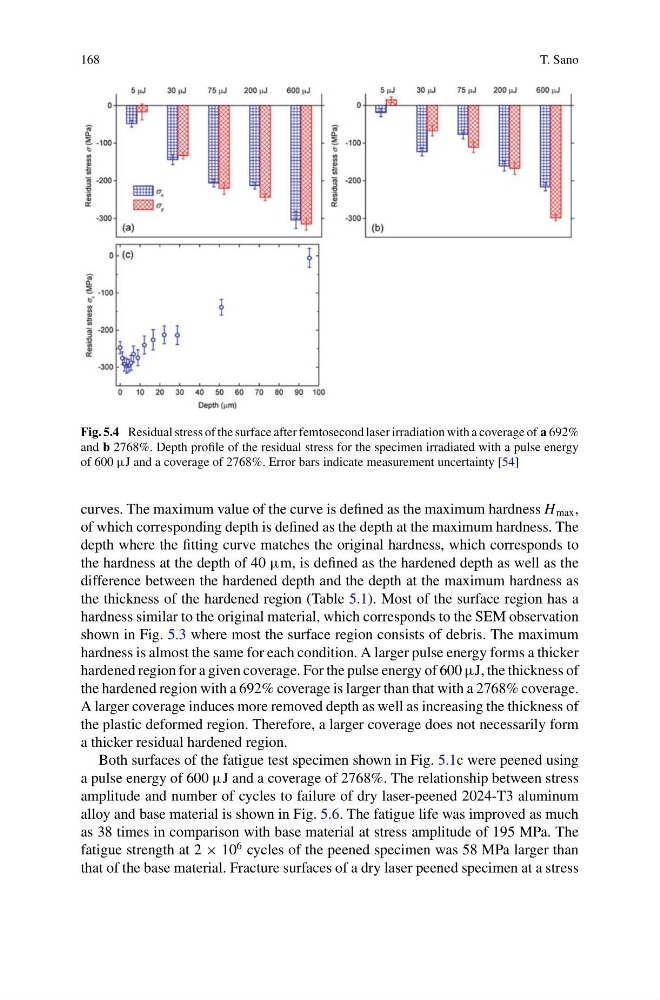
Fig. 5.4 Residual stress of the surface after femtosecond laser irradiation with a coverage of a 692%
and b 2768%. Depth profile of the residual stress for the specimen irradiated with a pulse energy
of 600 μJ and a coverage of 2768%. Error bars indicate measurement uncertainty [54]
curves. The maximum value of the curve is defined as the maximum hardness H max ,
of which corresponding depth is defined as the depth at the maximum hardness. The
depth where the fitting curve matches the original hardness, which corresponds to
the hardness at the depth of 40 μm, is defined as the hardened depth as well as the
difference between the hardened depth and the depth at the maximum hardness as
the thickness of the hardened region (Table 5.1). Most of the surface region has a
hardness similar to the original material, which corresponds to the SEM observation
shown in Fig. 5.3 where most the surface region consists of debris. The maximum
hardness is almost the same for each condition. A larger pulse energy forms a thicker
hardened region for a given coverage. For the pulse energy of 600 μJ, the thickness of
the hardened region with a 692% coverage is larger than that with a 2768% coverage.
A larger coverage induces more removed depth as well as increasing the thickness of
the plastic deformed region. Therefore, a larger coverage does not necessarily form
a thicker residual hardened region.
Both surfaces of the fatigue test specimen shown in Fig. 5.1c were peened using
a pulse energy of 600 μJ and a coverage of 2768%. The relationship between stress
amplitude and number of cycles to failure of dry laser-peened 2024-T3 aluminum
alloy and base material is shown in Fig. 5.6. The fatigue life was improved as much
as 38 times in comparison with base material at stress amplitude of 195 MPa. The
fatigue strength at 2 × 10
6 cycles of the peened specimen was 58 MPa larger than
that of the base material. Fracture surfaces of a dry laser peened specimen at a stress
T. Sano
Fig. 5.4 Residual stress of the surface after femtosecond laser irradiation with a coverage of a 692%
and b 2768%. Depth profile of the residual stress for the specimen irradiated with a pulse energy
of 600 μJ and a coverage of 2768%. Error bars indicate measurement uncertainty [54]
curves. The maximum value of the curve is defined as the maximum hardness H max ,
of which corresponding depth is defined as the depth at the maximum hardness. The
depth where the fitting curve matches the original hardness, which corresponds to
the hardness at the depth of 40 μm, is defined as the hardened depth as well as the
difference between the hardened depth and the depth at the maximum hardness as
the thickness of the hardened region (Table 5.1). Most of the surface region has a
hardness similar to the original material, which corresponds to the SEM observation
shown in Fig. 5.3 where most the surface region consists of debris. The maximum
hardness is almost the same for each condition. A larger pulse energy forms a thicker
hardened region for a given coverage. For the pulse energy of 600 μJ, the thickness of
the hardened region with a 692% coverage is larger than that with a 2768% coverage.
A larger coverage induces more removed depth as well as increasing the thickness of
the plastic deformed region. Therefore, a larger coverage does not necessarily form
a thicker residual hardened region.
Both surfaces of the fatigue test specimen shown in Fig. 5.1c were peened using
a pulse energy of 600 μJ and a coverage of 2768%. The relationship between stress
amplitude and number of cycles to failure of dry laser-peened 2024-T3 aluminum
alloy and base material is shown in Fig. 5.6. The fatigue life was improved as much
as 38 times in comparison with base material at stress amplitude of 195 MPa. The
fatigue strength at 2 × 10
6 cycles of the peened specimen was 58 MPa larger than
that of the base material. Fracture surfaces of a dry laser peened specimen at a stress