

128
I. Falcón Casas and W. Kautek
85
90
95
100
105
110
0
2
4
6
8
10
12
Laser Power (mW)
Depth (nm)
85
90
95
100
105
110
0
20
40
60
80
Laser Power (mW)
Width (nm)
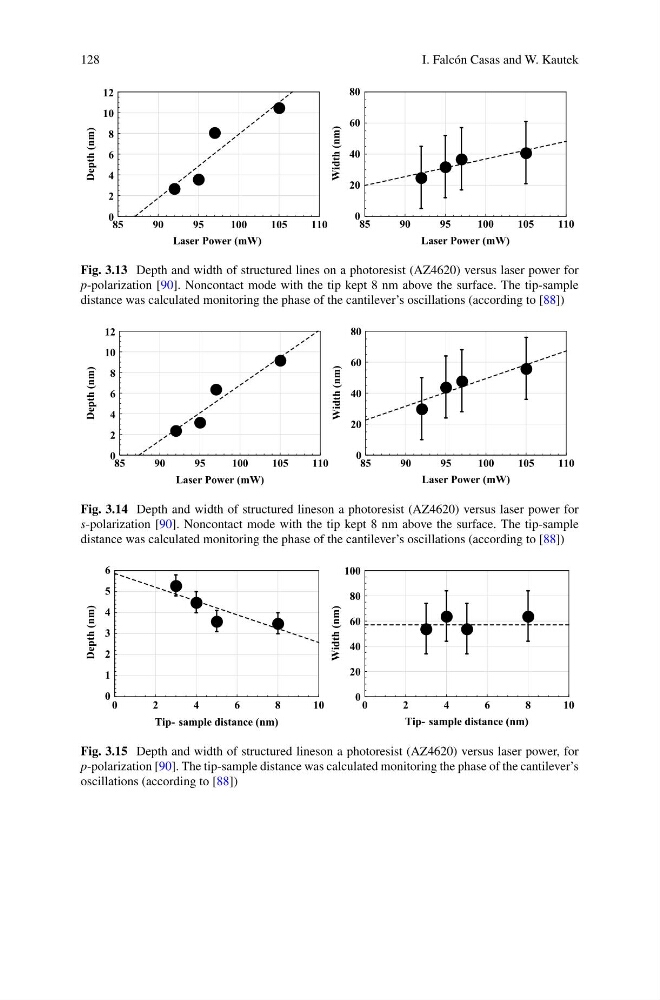
Fig. 3.13 Depth and width of structured lines on a photoresist (AZ4620) versus laser power for
p-polarization [90]. Noncontact mode with the tip kept 8 nm above the surface. The tip-sample
distance was calculated monitoring the phase of the cantilever’s oscillations (according to [88])
85
90
95
100
105
110
0
2
4
6
8
10
12
Laser Power (mW)
Depth (nm)
85
90
95
100
105
110
0
20
40
60
80
Laser Power (mW)
Width (nm)
Fig. 3.14 Depth and width of structured lineson a photoresist (AZ4620) versus laser power for
s-polarization [90]. Noncontact mode with the tip kept 8 nm above the surface. The tip-sample
distance was calculated monitoring the phase of the cantilever’s oscillations (according to [88])
0
2
4
6
8
1 0
0
1
2
3
4
5
6
Tip- sample distance (nm)
Depth (nm)
0
2
4
6
8
1 0
0
20
40
60
80
100
Tip- sample distance (nm)
Width (nm)
Fig. 3.15 Depth and width of structured lineson a photoresist (AZ4620) versus laser power, for
p-polarization [90]. The tip-sample distance was calculated monitoring the phase of the cantilever’s
oscillations (according to [88])
I. Falcón Casas and W. Kautek
85
90
95
100
105
110
0
2
4
6
8
10
12
Laser Power (mW)
Depth (nm)
85
90
95
100
105
110
0
20
40
60
80
Laser Power (mW)
Width (nm)
Fig. 3.13 Depth and width of structured lines on a photoresist (AZ4620) versus laser power for
p-polarization [90]. Noncontact mode with the tip kept 8 nm above the surface. The tip-sample
distance was calculated monitoring the phase of the cantilever’s oscillations (according to [88])
85
90
95
100
105
110
0
2
4
6
8
10
12
Laser Power (mW)
Depth (nm)
85
90
95
100
105
110
0
20
40
60
80
Laser Power (mW)
Width (nm)
Fig. 3.14 Depth and width of structured lineson a photoresist (AZ4620) versus laser power for
s-polarization [90]. Noncontact mode with the tip kept 8 nm above the surface. The tip-sample
distance was calculated monitoring the phase of the cantilever’s oscillations (according to [88])
0
2
4
6
8
1 0
0
1
2
3
4
5
6
Tip- sample distance (nm)
Depth (nm)
0
2
4
6
8
1 0
0
20
40
60
80
100
Tip- sample distance (nm)
Width (nm)
Fig. 3.15 Depth and width of structured lineson a photoresist (AZ4620) versus laser power, for
p-polarization [90]. The tip-sample distance was calculated monitoring the phase of the cantilever’s
oscillations (according to [88])