

74
5 Designing Meanders
CorrectedResistance = −0.56 + 0.92 · DesiredResistance.
(5.5)
In order to realize the desired resistance, the Meander Designer has to generate
a design with resistance CorrectedResistance. This corrected resistance value
eventually compensates the deviation resulting from the fabrication process.
In this case study, the whole fabrication process and measurements of new
corrected meander designs were not repeated. Instead, this case study demonstrates
the effect of the correction factor by correcting the desired resistances according to
the correction factor. More precisely:
• Let’s assume the CorrectedResistance is equal to 10, 15, 20, 25, 30, 40, or 50.
• This allows to determine the DesiredResistance by using the lump model,
which gives 11.48, 16.91, 22.35, 27.78, 33.22, 44.09, and 54.96.
• When now the Meander Designer would be applied again to realize meanders
with the DesiredResistance and additionally taking the correction factor into
account, exactly the designs would result as before when no correction factor was
used.
• This allows to compare the obtained desired resistances with the previously
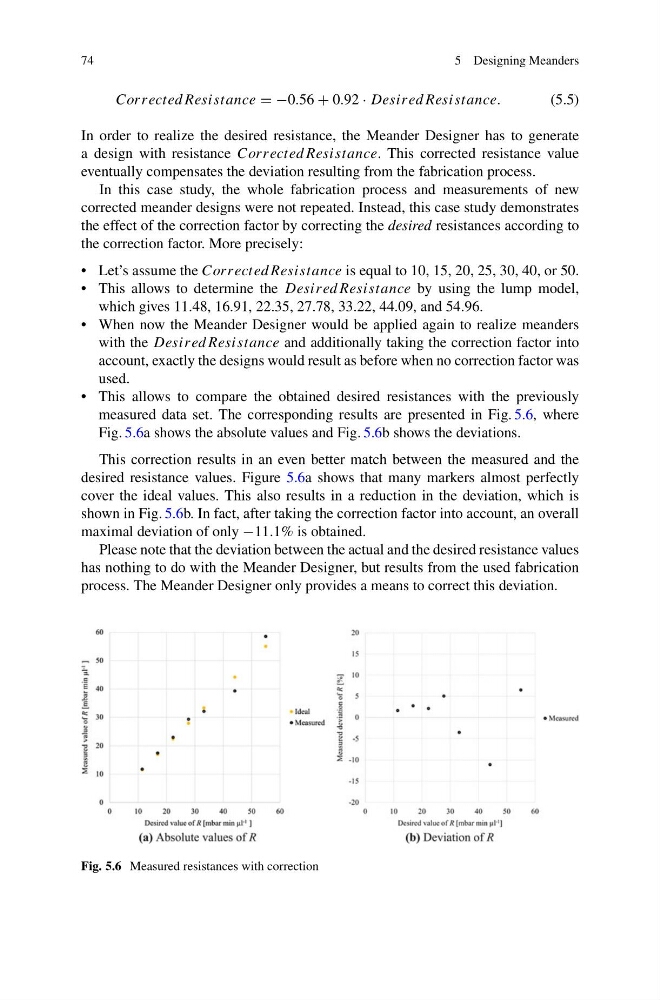
measured data set. The corresponding results are presented in Fig. 5.6, where
Fig. 5.6a shows the absolute values and Fig. 5.6b shows the deviations.
This correction results in an even better match between the measured and the
desired resistance values. Figure 5.6a shows that many markers almost perfectly
cover the ideal values. This also results in a reduction in the deviation, which is
shown in Fig. 5.6b. In fact, after taking the correction factor into account, an overall
maximal deviation of only −11.1% is obtained.
Please note that the deviation between the actual and the desired resistance values
has nothing to do with the Meander Designer, but results from the used fabrication
process. The Meander Designer only provides a means to correct this deviation.
Fig. 5.6 Measured resistances with correction
5 Designing Meanders
CorrectedResistance = −0.56 + 0.92 · DesiredResistance.
(5.5)
In order to realize the desired resistance, the Meander Designer has to generate
a design with resistance CorrectedResistance. This corrected resistance value
eventually compensates the deviation resulting from the fabrication process.
In this case study, the whole fabrication process and measurements of new
corrected meander designs were not repeated. Instead, this case study demonstrates
the effect of the correction factor by correcting the desired resistances according to
the correction factor. More precisely:
• Let’s assume the CorrectedResistance is equal to 10, 15, 20, 25, 30, 40, or 50.
• This allows to determine the DesiredResistance by using the lump model,
which gives 11.48, 16.91, 22.35, 27.78, 33.22, 44.09, and 54.96.
• When now the Meander Designer would be applied again to realize meanders
with the DesiredResistance and additionally taking the correction factor into
account, exactly the designs would result as before when no correction factor was
used.
• This allows to compare the obtained desired resistances with the previously
measured data set. The corresponding results are presented in Fig. 5.6, where
Fig. 5.6a shows the absolute values and Fig. 5.6b shows the deviations.
This correction results in an even better match between the measured and the
desired resistance values. Figure 5.6a shows that many markers almost perfectly
cover the ideal values. This also results in a reduction in the deviation, which is
shown in Fig. 5.6b. In fact, after taking the correction factor into account, an overall
maximal deviation of only −11.1% is obtained.
Please note that the deviation between the actual and the desired resistance values
has nothing to do with the Meander Designer, but results from the used fabrication
process. The Meander Designer only provides a means to correct this deviation.
Fig. 5.6 Measured resistances with correction