

5.4 Results of Case Studies
75
Overall, the designs automatically generated by the Meander Designer provide
a good basis for the fabrication process and indeed lead to fabricated designs that
almost perfectly match the desired specifications.
5.4.2 Results for Dedicated Mixing Ratios
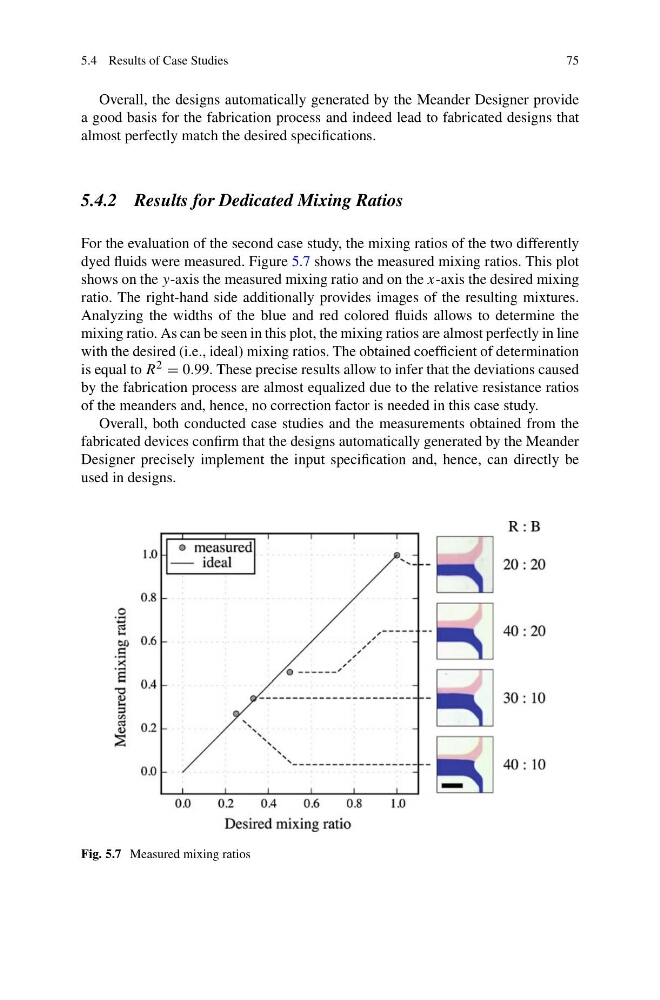
For the evaluation of the second case study, the mixing ratios of the two differently
dyed fluids were measured. Figure 5.7 shows the measured mixing ratios. This plot
shows on the y-axis the measured mixing ratio and on the x-axis the desired mixing
ratio. The right-hand side additionally provides images of the resulting mixtures.
Analyzing the widths of the blue and red colored fluids allows to determine the
mixing ratio. As can be seen in this plot, the mixing ratios are almost perfectly in line
with the desired (i.e., ideal) mixing ratios. The obtained coefficient of determination
is equal to R 2 = 0.99. These precise results allow to infer that the deviations caused
by the fabrication process are almost equalized due to the relative resistance ratios
of the meanders and, hence, no correction factor is needed in this case study.
Overall, both conducted case studies and the measurements obtained from the
fabricated devices confirm that the designs automatically generated by the Meander
Designer precisely implement the input specification and, hence, can directly be
used in designs.
Fig. 5.7 Measured mixing ratios
75
Overall, the designs automatically generated by the Meander Designer provide
a good basis for the fabrication process and indeed lead to fabricated designs that
almost perfectly match the desired specifications.
5.4.2 Results for Dedicated Mixing Ratios
For the evaluation of the second case study, the mixing ratios of the two differently
dyed fluids were measured. Figure 5.7 shows the measured mixing ratios. This plot
shows on the y-axis the measured mixing ratio and on the x-axis the desired mixing
ratio. The right-hand side additionally provides images of the resulting mixtures.
Analyzing the widths of the blue and red colored fluids allows to determine the
mixing ratio. As can be seen in this plot, the mixing ratios are almost perfectly in line
with the desired (i.e., ideal) mixing ratios. The obtained coefficient of determination
is equal to R 2 = 0.99. These precise results allow to infer that the deviations caused
by the fabrication process are almost equalized due to the relative resistance ratios
of the meanders and, hence, no correction factor is needed in this case study.
Overall, both conducted case studies and the measurements obtained from the
fabricated devices confirm that the designs automatically generated by the Meander
Designer precisely implement the input specification and, hence, can directly be
used in designs.
Fig. 5.7 Measured mixing ratios