

C
C sp =
m
(7.4)
m
E 1
E 2
– 0. 3
– 10. 0
– 8. 0
– 6. 0
– 4. 0
– 2. 0
0. 0
2. 0
4. 0
6. 0
8. 0
10. 0
– 200
– 150
– 100
– 50
0
50
100
150
200
– 0. 1
0. 1
0. 3
0. 5
0. 7
Specifi c C urrent, A. g – 1
Specifi c C apacitance, A. g
– 1
0. 9
1. 1
1. 3
1. 5
Electrode Potential, V vs. RHE
285
Characterization and Diagnosis Techniques
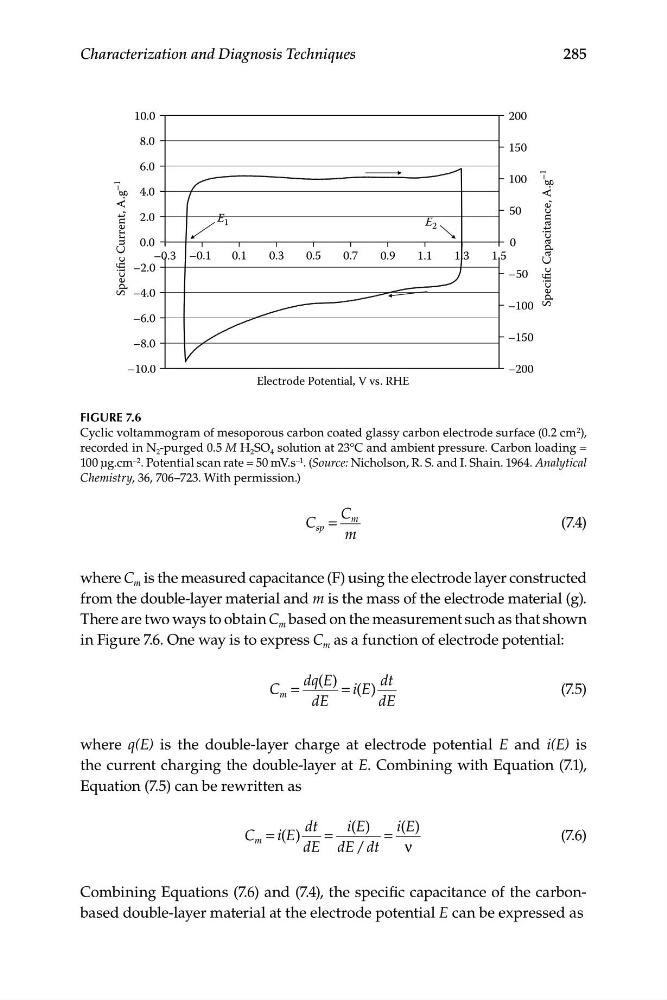
FIGURE 7.6
Cyclic voltammogram of mesoporous carbon coated glassy carbon electrode surface (0.2 cm 2 ),
recorded in N 2 -purged 0.5 M H 2 SO 4 solution at 23°C and ambient pressure. Carbon loading =
100 μg.cm –2 . Potential scan rate = 50 mV.s –1 . (Source: Nicholson, R. S. and I. Shain. 1964. Analytical
Chemistry, 36, 706–723. With permission.)
where C m is the measured capacitance (F) using the electrode layer constructed
from the double-layer material and m is the mass of the electrode material (g).
There are two ways to obtain C m based on the measurement such as that shown
in Figure 7.6. One way is to express C m as a function of electrode potential:
dq E
dt
( )
C m =
= i E
( )
(7.5)
dE
dE
where q(E) is the double-layer charge at electrode potential E and i(E) is
the current charging the double-layer at E. Combining with Equation (7.1),
Equation (7.5) can be rewritten as
dt
i E
( )
i E
( )
C m = i E
( )
=
=
(7.6)
dE dE / dt
ν
Combining Equations (7.6) and (7.4), the specific capacitance of the carbonbased double-layer material at the electrode potential E can be expressed as
C sp =
m
(7.4)
m
E 1
E 2
– 0. 3
– 10. 0
– 8. 0
– 6. 0
– 4. 0
– 2. 0
0. 0
2. 0
4. 0
6. 0
8. 0
10. 0
– 200
– 150
– 100
– 50
0
50
100
150
200
– 0. 1
0. 1
0. 3
0. 5
0. 7
Specifi c C urrent, A. g – 1
Specifi c C apacitance, A. g
– 1
0. 9
1. 1
1. 3
1. 5
Electrode Potential, V vs. RHE
285
Characterization and Diagnosis Techniques
FIGURE 7.6
Cyclic voltammogram of mesoporous carbon coated glassy carbon electrode surface (0.2 cm 2 ),
recorded in N 2 -purged 0.5 M H 2 SO 4 solution at 23°C and ambient pressure. Carbon loading =
100 μg.cm –2 . Potential scan rate = 50 mV.s –1 . (Source: Nicholson, R. S. and I. Shain. 1964. Analytical
Chemistry, 36, 706–723. With permission.)
where C m is the measured capacitance (F) using the electrode layer constructed
from the double-layer material and m is the mass of the electrode material (g).
There are two ways to obtain C m based on the measurement such as that shown
in Figure 7.6. One way is to express C m as a function of electrode potential:
dq E
dt
( )
C m =
= i E
( )
(7.5)
dE
dE
where q(E) is the double-layer charge at electrode potential E and i(E) is
the current charging the double-layer at E. Combining with Equation (7.1),
Equation (7.5) can be rewritten as
dt
i E
( )
i E
( )
C m = i E
( )
=
=
(7.6)
dE dE / dt
ν
Combining Equations (7.6) and (7.4), the specific capacitance of the carbonbased double-layer material at the electrode potential E can be expressed as