

0.0025
0.0020
0.0015
0.0010
0.0005
0.0000
–0.0005
–0.0010
–0.0015
–0.0020
–0.0025
Current Density, A.cm –2
Electrode Potential, V vs. RHE
0.2
0.4
0.6
0.8
1.0
1.2
0.0
284
Electrochemical Supercapacitors for Energy Storage and Delivery
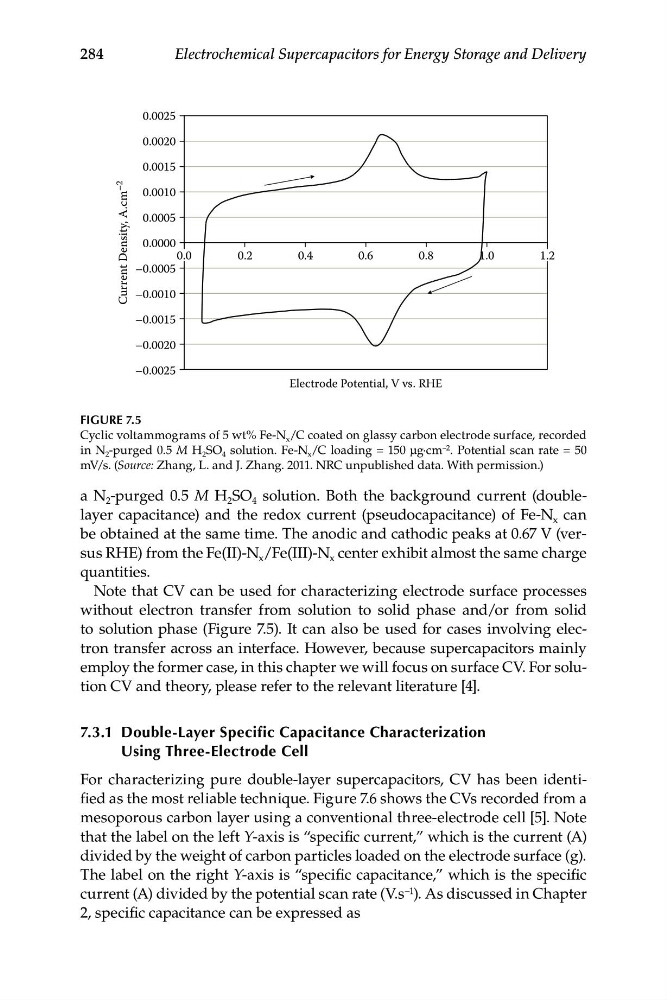
FIGURE 7.5
Cyclic voltammograms of 5 wt% Fe-N x /C coated on glassy carbon electrode surface, recorded
in N 2 -purged 0.5 M H 2 SO 4 solution. Fe-N x /C loading = 150 μg·cm –2 . Potential scan rate = 50
mV/s. (Source: Zhang, L. and J. Zhang. 2011. NRC unpublished data. With permission.)
a N 2 -purged 0.5 M H 2 SO 4 solution. Both the background current (doublelayer capacitance) and the redox current (pseudocapacitance) of Fe-N x can
be obtained at the same time. The anodic and cathodic peaks at 0.67 V (versus RHE) from the Fe(II)-N x /Fe(III)-N x center exhibit almost the same charge
quantities.
Note that CV can be used for characterizing electrode surface processes
without electron transfer from solution to solid phase and/or from solid
to solution phase (Figure 7.5). It can also be used for cases involving electron transfer across an interface. However, because supercapacitors mainly
employ the former case, in this chapter we will focus on surface CV. For solution CV and theory, please refer to the relevant literature [4].
7.3.1 Double-Layer Specific Capacitance Characterization
Using Three-Electrode Cell
For characterizing pure double-layer supercapacitors, CV has been identified as the most reliable technique. Figure 7.6 shows the CVs recorded from a
mesoporous carbon layer using a conventional three-electrode cell [5]. Note
that the label on the left Y-axis is “specific current,” which is the current (A)
divided by the weight of carbon particles loaded on the electrode surface (g).
The label on the right Y-axis is “specific capacitance,” which is the specific
current (A) divided by the potential scan rate (V.s –1 ). As discussed in Chapter
2, specific capacitance can be expressed as
0.0020
0.0015
0.0010
0.0005
0.0000
–0.0005
–0.0010
–0.0015
–0.0020
–0.0025
Current Density, A.cm –2
Electrode Potential, V vs. RHE
0.2
0.4
0.6
0.8
1.0
1.2
0.0
284
Electrochemical Supercapacitors for Energy Storage and Delivery
FIGURE 7.5
Cyclic voltammograms of 5 wt% Fe-N x /C coated on glassy carbon electrode surface, recorded
in N 2 -purged 0.5 M H 2 SO 4 solution. Fe-N x /C loading = 150 μg·cm –2 . Potential scan rate = 50
mV/s. (Source: Zhang, L. and J. Zhang. 2011. NRC unpublished data. With permission.)
a N 2 -purged 0.5 M H 2 SO 4 solution. Both the background current (doublelayer capacitance) and the redox current (pseudocapacitance) of Fe-N x can
be obtained at the same time. The anodic and cathodic peaks at 0.67 V (versus RHE) from the Fe(II)-N x /Fe(III)-N x center exhibit almost the same charge
quantities.
Note that CV can be used for characterizing electrode surface processes
without electron transfer from solution to solid phase and/or from solid
to solution phase (Figure 7.5). It can also be used for cases involving electron transfer across an interface. However, because supercapacitors mainly
employ the former case, in this chapter we will focus on surface CV. For solution CV and theory, please refer to the relevant literature [4].
7.3.1 Double-Layer Specific Capacitance Characterization
Using Three-Electrode Cell
For characterizing pure double-layer supercapacitors, CV has been identified as the most reliable technique. Figure 7.6 shows the CVs recorded from a
mesoporous carbon layer using a conventional three-electrode cell [5]. Note
that the label on the left Y-axis is “specific current,” which is the current (A)
divided by the weight of carbon particles loaded on the electrode surface (g).
The label on the right Y-axis is “specific capacitance,” which is the specific
current (A) divided by the potential scan rate (V.s –1 ). As discussed in Chapter
2, specific capacitance can be expressed as