

262
Electrochemical Supercapacitors for Energy Storage and Delivery
C P2
R L
L
Circuit 3
Circuit 2
Circuit 1
C a
CV
R e
R V
C P1
C R
R i
R i
C i
R P2
R P1
(a)
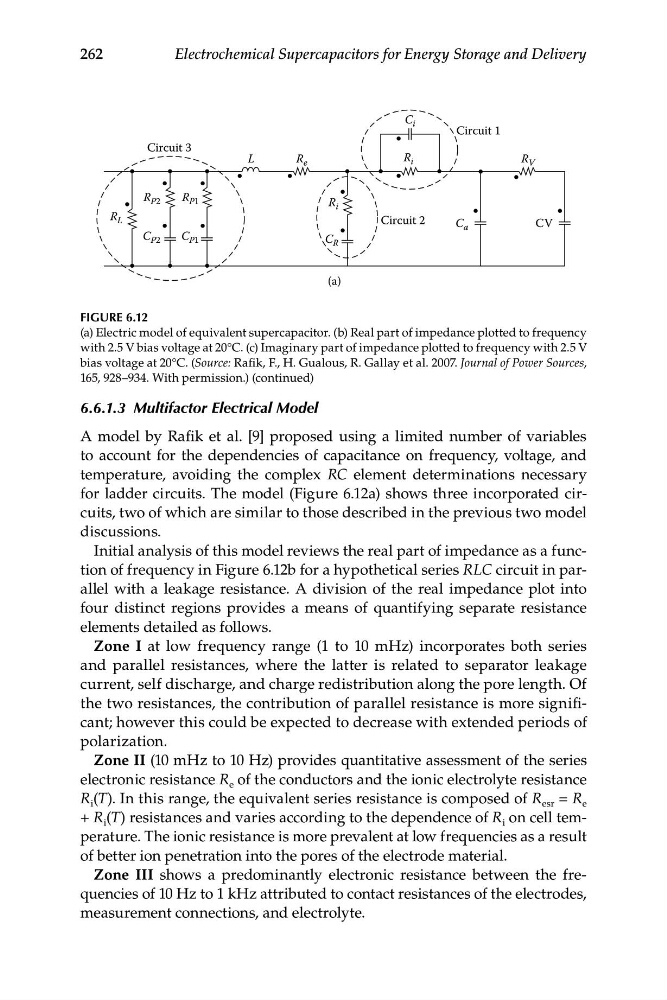
FIGURE 6.12
(a) Electric model of equivalent supercapacitor. (b) Real part of impedance plotted to frequency
with 2.5 V bias voltage at 20°C. (c) Imaginary part of impedance plotted to frequency with 2.5 V
bias voltage at 20°C. (Source: Rafik, F., H. Gualous, R. Gallay et al. 2007. Journal of Power Sources,
165, 928–934. With permission.) (continued)
6.6.1.3 Multifactor Electrical Model
A model by Rafik et al. [9] proposed using a limited number of variables
to account for the dependencies of capacitance on frequency, voltage, and
temperature, avoiding the complex RC element determinations necessary
for ladder circuits. The model (Figure 6.12a) shows three incorporated circuits, two of which are similar to those described in the previous two model
discussions.
Initial analysis of this model reviews the real part of impedance as a function of frequency in Figure 6.12b for a hypothetical series RLC circuit in parallel with a leakage resistance. A division of the real impedance plot into
four distinct regions provides a means of quantifying separate resistance
elements detailed as follows.
Zone I at low frequency range (1 to 10 mHz) incorporates both series
and parallel resistances, where the latter is related to separator leakage
current, self discharge, and charge redistribution along the pore length. Of
the two resistances, the contribution of parallel resistance is more significant; however this could be expected to decrease with extended periods of
polarization.
Zone II (10 mHz to 10 Hz) provides quantitative assessment of the series
electronic resistance R e of the conductors and the ionic electrolyte resistance
R i (T). In this range, the equivalent series resistance is composed of R esr = R e
+ R i (T) resistances and varies according to the dependence of R i on cell temperature. The ionic resistance is more prevalent at low frequencies as a result
of better ion penetration into the pores of the electrode material.
Zone III shows a predominantly electronic resistance between the frequencies of 10 Hz to 1 kHz attributed to contact resistances of the electrodes,
measurement connections, and electrolyte.
Electrochemical Supercapacitors for Energy Storage and Delivery
C P2
R L
L
Circuit 3
Circuit 2
Circuit 1
C a
CV
R e
R V
C P1
C R
R i
R i
C i
R P2
R P1
(a)
FIGURE 6.12
(a) Electric model of equivalent supercapacitor. (b) Real part of impedance plotted to frequency
with 2.5 V bias voltage at 20°C. (c) Imaginary part of impedance plotted to frequency with 2.5 V
bias voltage at 20°C. (Source: Rafik, F., H. Gualous, R. Gallay et al. 2007. Journal of Power Sources,
165, 928–934. With permission.) (continued)
6.6.1.3 Multifactor Electrical Model
A model by Rafik et al. [9] proposed using a limited number of variables
to account for the dependencies of capacitance on frequency, voltage, and
temperature, avoiding the complex RC element determinations necessary
for ladder circuits. The model (Figure 6.12a) shows three incorporated circuits, two of which are similar to those described in the previous two model
discussions.
Initial analysis of this model reviews the real part of impedance as a function of frequency in Figure 6.12b for a hypothetical series RLC circuit in parallel with a leakage resistance. A division of the real impedance plot into
four distinct regions provides a means of quantifying separate resistance
elements detailed as follows.
Zone I at low frequency range (1 to 10 mHz) incorporates both series
and parallel resistances, where the latter is related to separator leakage
current, self discharge, and charge redistribution along the pore length. Of
the two resistances, the contribution of parallel resistance is more significant; however this could be expected to decrease with extended periods of
polarization.
Zone II (10 mHz to 10 Hz) provides quantitative assessment of the series
electronic resistance R e of the conductors and the ionic electrolyte resistance
R i (T). In this range, the equivalent series resistance is composed of R esr = R e
+ R i (T) resistances and varies according to the dependence of R i on cell temperature. The ionic resistance is more prevalent at low frequencies as a result
of better ion penetration into the pores of the electrode material.
Zone III shows a predominantly electronic resistance between the frequencies of 10 Hz to 1 kHz attributed to contact resistances of the electrodes,
measurement connections, and electrolyte.