

Leakage
current effect
R 1 (T)
R e
I
0.001 0.01
0.
0.006
0.004
0.0014
0.0012
0.001
0.0008
0.0006
0.0004
R s (T)
0.0002
Imaginary Part (ohm)
0.002
0
0.001 0.01 0.1
–0.002
–0.004
–0.006
1000 10000 100000
1000 10000
IV
0
1
Inductive
behavior
Resonance Frequency
Capacitive
Behavior
Frequency (Hz)
10
100
(b)
1
10
100
Frequency (Hz)
(c)
Real part 2.5 V (20°C)
II
III
1
263
Coupling with Batteries and Fuel Cells
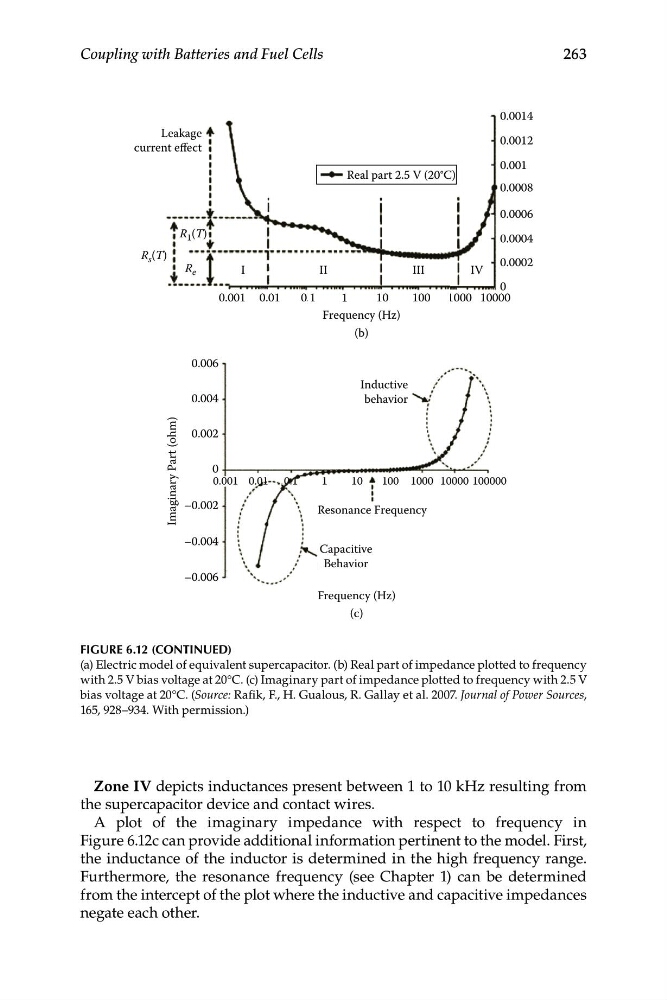
FIGURE 6.12 (CONTINUED)
(a) Electric model of equivalent supercapacitor. (b) Real part of impedance plotted to frequency
with 2.5 V bias voltage at 20°C. (c) Imaginary part of impedance plotted to frequency with 2.5 V
bias voltage at 20°C. (Source: Rafik, F., H. Gualous, R. Gallay et al. 2007. Journal of Power Sources,
165, 928–934. With permission.)
Zone IV depicts inductances present between 1 to 10 kHz resulting from
the supercapacitor device and contact wires.
A plot of the imaginary impedance with respect to frequency in
Figure 6.12c can provide additional information pertinent to the model. First,
the inductance of the inductor is determined in the high frequency range.
Furthermore, the resonance frequency (see Chapter 1) can be determined
from the intercept of the plot where the inductive and capacitive impedances
negate each other.
current effect
R 1 (T)
R e
I
0.001 0.01
0.
0.006
0.004
0.0014
0.0012
0.001
0.0008
0.0006
0.0004
R s (T)
0.0002
Imaginary Part (ohm)
0.002
0
0.001 0.01 0.1
–0.002
–0.004
–0.006
1000 10000 100000
1000 10000
IV
0
1
Inductive
behavior
Resonance Frequency
Capacitive
Behavior
Frequency (Hz)
10
100
(b)
1
10
100
Frequency (Hz)
(c)
Real part 2.5 V (20°C)
II
III
1
263
Coupling with Batteries and Fuel Cells
FIGURE 6.12 (CONTINUED)
(a) Electric model of equivalent supercapacitor. (b) Real part of impedance plotted to frequency
with 2.5 V bias voltage at 20°C. (c) Imaginary part of impedance plotted to frequency with 2.5 V
bias voltage at 20°C. (Source: Rafik, F., H. Gualous, R. Gallay et al. 2007. Journal of Power Sources,
165, 928–934. With permission.)
Zone IV depicts inductances present between 1 to 10 kHz resulting from
the supercapacitor device and contact wires.
A plot of the imaginary impedance with respect to frequency in
Figure 6.12c can provide additional information pertinent to the model. First,
the inductance of the inductor is determined in the high frequency range.
Furthermore, the resonance frequency (see Chapter 1) can be determined
from the intercept of the plot where the inductive and capacitive impedances
negate each other.