

2e -
2e -
2H 2 SO 4
4H + , SO 4 2- ,SO 4 22H 2 O
I
PbSO 4
PbSO 4 +4H 2 O
Pb
PbO
2
Pb 2+ +4OH -
–
+
(a)
Negative Cell
Connection
Pole
Valve
Positive
Pole
Microporous Separator
Negative
Plate
Positive
Plate
Grid
Plate
Negative
(b)
15
1.5 M
1.5 M
1.5 M
1.0 & 1.4 M
1.7 M
I
II
III
B
C
E
D
IV
Normalized Capacitance (μF cm –2
)
10
5
0
E
0
1
2
3
Average Pore Size (nm)
–
4
5
A
–
+
+
+
+
+
+
15 25 35 45
–
–
–
–
δ–
δ–
δ–
δ–
δ–
δ–
δ–
δ–
+
–
+
+
+
–
–
–
–
–
–
–
–
–
–
–
+
+
+
+
+
+
+
+
+
+
+
–
–
d
a
b
FIGURE 4.2
(a) Lead acid battery showing anode, cathode, and sulfuric acid electrolyte. (b) Cross section
of lead acid battery pack. Separation of plates is created by a nonconductive separator; cells
are stacked within battery module. (Sources: Worlds of David Darling Encyclopedia (online).
Lead–acid battery. http,//www.daviddarling.info/encyclopedia/L/AE_lead–acid_battery.
html [accessed April 4, 2012]; Georgia State University. 2012. Lead–acid battery: hyperphysics
(online). http,//hyperphysics.phy–astr.gsu.edu/hbase/electric/leadacid.html [accessed April
9, 2012]. With permission.)
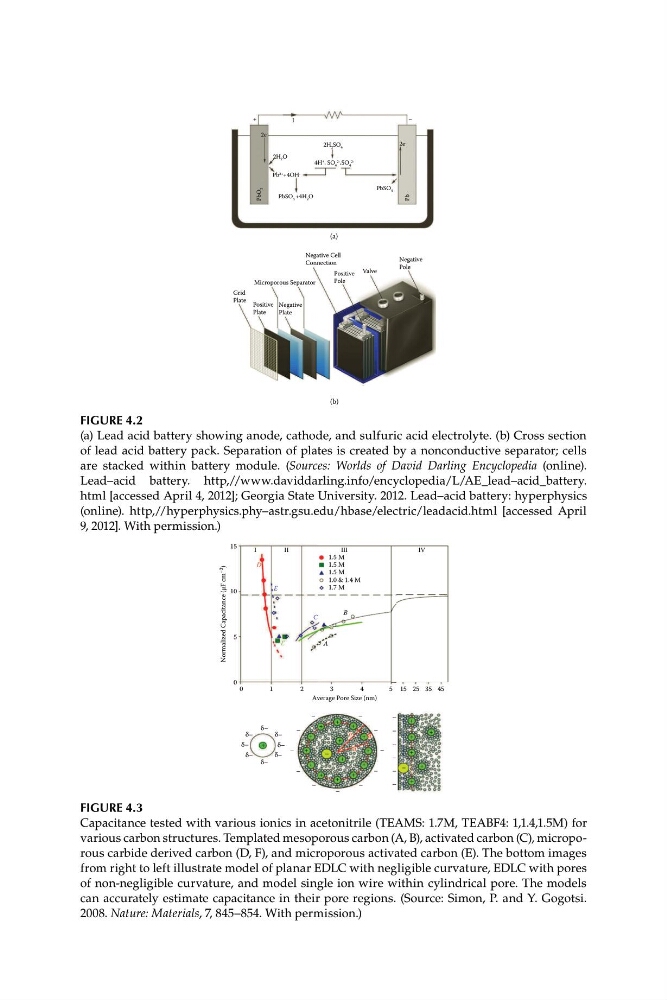
FIGURE 4.3
Capacitance tested with various ionics in acetonitrile (TEAMS: 1.7M, TEABF4: 1,1.4,1.5M) for
various carbon structures. Templated mesoporous carbon (A, B), activated carbon (C), microporous carbide derived carbon (D, F), and microporous activated carbon (E). The bottom images
from right to left illustrate model of planar EDLC with negligible curvature, EDLC with pores
of non-negligible curvature, and model single ion wire within cylindrical pore. The models
can accurately estimate capacitance in their pore regions. (Source: Simon, P. and Y. Gogotsi.
2008. Nature: Materials, 7, 845–854. With permission.)
2e -
2H 2 SO 4
4H + , SO 4 2- ,SO 4 22H 2 O
I
PbSO 4
PbSO 4 +4H 2 O
Pb
PbO
2
Pb 2+ +4OH -
–
+
(a)
Negative Cell
Connection
Pole
Valve
Positive
Pole
Microporous Separator
Negative
Plate
Positive
Plate
Grid
Plate
Negative
(b)
15
1.5 M
1.5 M
1.5 M
1.0 & 1.4 M
1.7 M
I
II
III
B
C
E
D
IV
Normalized Capacitance (μF cm –2
)
10
5
0
E
0
1
2
3
Average Pore Size (nm)
–
4
5
A
–
+
+
+
+
+
+
15 25 35 45
–
–
–
–
δ–
δ–
δ–
δ–
δ–
δ–
δ–
δ–
+
–
+
+
+
–
–
–
–
–
–
–
–
–
–
–
+
+
+
+
+
+
+
+
+
+
+
–
–
d
a
b
FIGURE 4.2
(a) Lead acid battery showing anode, cathode, and sulfuric acid electrolyte. (b) Cross section
of lead acid battery pack. Separation of plates is created by a nonconductive separator; cells
are stacked within battery module. (Sources: Worlds of David Darling Encyclopedia (online).
Lead–acid battery. http,//www.daviddarling.info/encyclopedia/L/AE_lead–acid_battery.
html [accessed April 4, 2012]; Georgia State University. 2012. Lead–acid battery: hyperphysics
(online). http,//hyperphysics.phy–astr.gsu.edu/hbase/electric/leadacid.html [accessed April
9, 2012]. With permission.)
FIGURE 4.3
Capacitance tested with various ionics in acetonitrile (TEAMS: 1.7M, TEABF4: 1,1.4,1.5M) for
various carbon structures. Templated mesoporous carbon (A, B), activated carbon (C), microporous carbide derived carbon (D, F), and microporous activated carbon (E). The bottom images
from right to left illustrate model of planar EDLC with negligible curvature, EDLC with pores
of non-negligible curvature, and model single ion wire within cylindrical pore. The models
can accurately estimate capacitance in their pore regions. (Source: Simon, P. and Y. Gogotsi.
2008. Nature: Materials, 7, 845–854. With permission.)