

(a)
0.003
0.000
–0.003
Current (A)
0.006
0.000
–0.006
Current (A)
0.2 V/s
0.1 V/s
0.05 V/s
0.02 V/s
0.01 V/s
0.2 V/s
0.1 V/s
0.05 V/s
0.02 V/s
0.01 V/s
–0.4 –0.2
(b)
Potential (A)
0.0
0.2
0.4
0.6
–0.4 –0.2
(c)
Potential (A)
0.0
0.2
0.4
0.6
100
80
25 nm
50 nm
75 nm
100 nm
20
25 nm
50 nm
75 nm
100 nm
400
600
800
1000
Wavelength (nm)
(a)
(b)
Transmittance (%)
60
40
FIGURE 4.16
(a) Capacitive performance of chemically reduced graphene over large range of current density
for different handling methodologies. (b) Ragone plot illustrating strong energy performance
and average power density in ionic liquid electrolyte. (Source: Yang, X. et al. 2011. Advanced
Materials, 23, 2833–2838. With permission.)
Coelectrodeposition
MnO 2 /PEDOT
Coaxial
Nanowires
Template
removal
MnO 2 /PEDOT Naniwires
MnO 2 /PEDOT
Coaxial Nanowire in Template
Au-sputtered
Ring-shape Electrodes
MnO 2 core
Template
Mn 2+ ions
EDOT monomer
Bottom gold
PEDOT shell
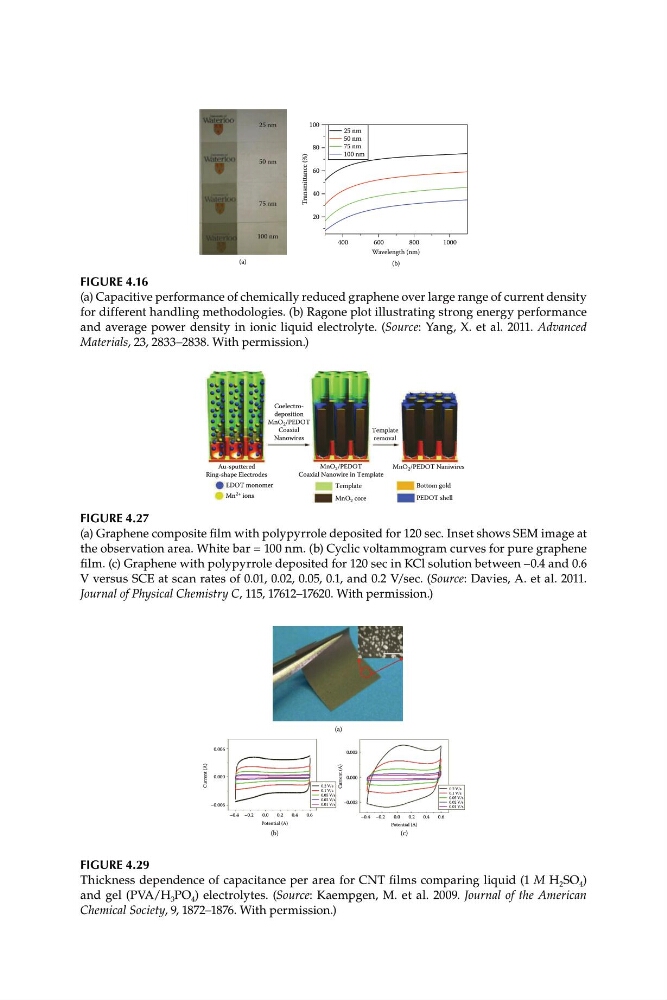
FIGURE 4.27
(a) Graphene composite film with polypyrrole deposited for 120 sec. Inset shows SEM image at
the observation area. White bar = 100 nm. (b) Cyclic voltammogram curves for pure graphene
film. (c) Graphene with polypyrrole deposited for 120 sec in KCl solution between –0.4 and 0.6
V versus SCE at scan rates of 0.01, 0.02, 0.05, 0.1, and 0.2 V/sec. (Source: Davies, A. et al. 2011.
Journal of Physical Chemistry C, 115, 17612–17620. With permission.)
FIGURE 4.29
Thickness dependence of capacitance per area for CNT films comparing liquid (1 M H 2 SO 4 )
and gel (PVA/H 3 PO 4 ) electrolytes. (Source: Kaempgen, M. et al. 2009. Journal of the American
Chemical Society, 9, 1872–1876. With permission.)
0.003
0.000
–0.003
Current (A)
0.006
0.000
–0.006
Current (A)
0.2 V/s
0.1 V/s
0.05 V/s
0.02 V/s
0.01 V/s
0.2 V/s
0.1 V/s
0.05 V/s
0.02 V/s
0.01 V/s
–0.4 –0.2
(b)
Potential (A)
0.0
0.2
0.4
0.6
–0.4 –0.2
(c)
Potential (A)
0.0
0.2
0.4
0.6
100
80
25 nm
50 nm
75 nm
100 nm
20
25 nm
50 nm
75 nm
100 nm
400
600
800
1000
Wavelength (nm)
(a)
(b)
Transmittance (%)
60
40
FIGURE 4.16
(a) Capacitive performance of chemically reduced graphene over large range of current density
for different handling methodologies. (b) Ragone plot illustrating strong energy performance
and average power density in ionic liquid electrolyte. (Source: Yang, X. et al. 2011. Advanced
Materials, 23, 2833–2838. With permission.)
Coelectrodeposition
MnO 2 /PEDOT
Coaxial
Nanowires
Template
removal
MnO 2 /PEDOT Naniwires
MnO 2 /PEDOT
Coaxial Nanowire in Template
Au-sputtered
Ring-shape Electrodes
MnO 2 core
Template
Mn 2+ ions
EDOT monomer
Bottom gold
PEDOT shell
FIGURE 4.27
(a) Graphene composite film with polypyrrole deposited for 120 sec. Inset shows SEM image at
the observation area. White bar = 100 nm. (b) Cyclic voltammogram curves for pure graphene
film. (c) Graphene with polypyrrole deposited for 120 sec in KCl solution between –0.4 and 0.6
V versus SCE at scan rates of 0.01, 0.02, 0.05, 0.1, and 0.2 V/sec. (Source: Davies, A. et al. 2011.
Journal of Physical Chemistry C, 115, 17612–17620. With permission.)
FIGURE 4.29
Thickness dependence of capacitance per area for CNT films comparing liquid (1 M H 2 SO 4 )
and gel (PVA/H 3 PO 4 ) electrolytes. (Source: Kaempgen, M. et al. 2009. Journal of the American
Chemical Society, 9, 1872–1876. With permission.)