

3 Anti-solvent Crystallization Method for Production …
67
Table 3.3 Experimental conditions and results of Method D
Run
Method
Anti-solvent
addition rate
(g/min)
Batch time (h)
Temperature
profile (K)
Final poly
Yield (%)
7
D
2.70
2
From 313 to
333
γ -form
27
8
D
2.70
2
From 313 to
323
and from 323
to 313
γ -form
65
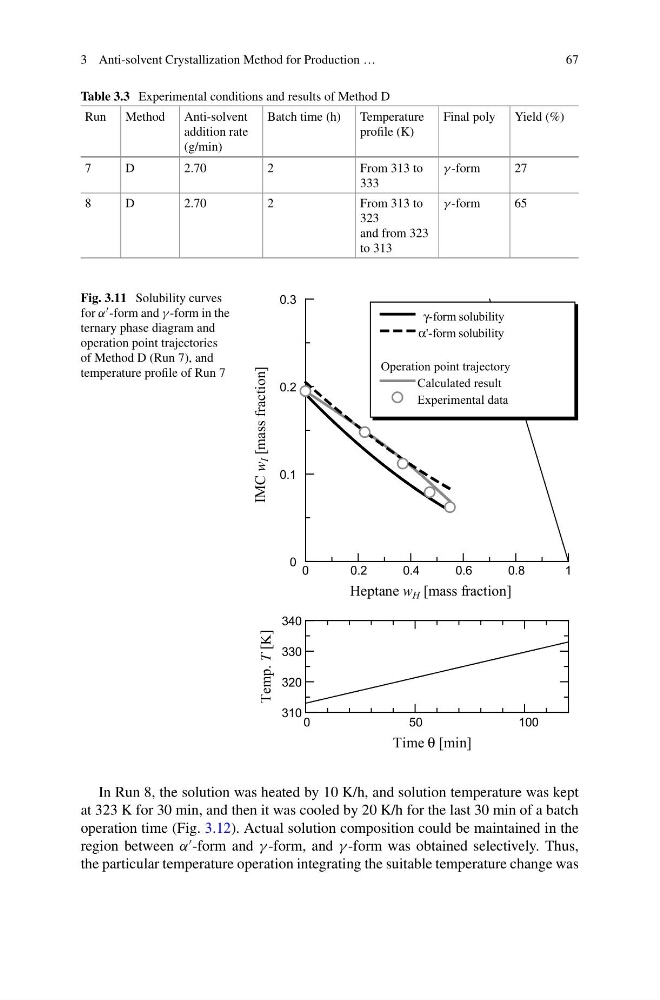
Fig. 3.11 Solubility curves
for α -form and γ -form in the
ternary phase diagram and
operation point trajectories
of Method D (Run 7), and
temperature profile of Run 7
0
0.2
0.4
0.6
0.8
1
0
0.1
0.2
0.3
Heptane w H [mass fraction]
IMC w
I [mass fraction]
γ-form solubility
α'-form solubility
Operation point trajectory
Calculated result
Experimental data
0
50
100
310
320
330
340
Time θ [min]
Temp. T [K]
In Run 8, the solution was heated by 10 K/h, and solution temperature was kept
at 323 K for 30 min, and then it was cooled by 20 K/h for the last 30 min of a batch
operation time (Fig. 3.12). Actual solution composition could be maintained in the
region between α
-form and γ -form, and γ -form was obtained selectively. Thus,
the particular temperature operation integrating the suitable temperature change was
67
Table 3.3 Experimental conditions and results of Method D
Run
Method
Anti-solvent
addition rate
(g/min)
Batch time (h)
Temperature
profile (K)
Final poly
Yield (%)
7
D
2.70
2
From 313 to
333
γ -form
27
8
D
2.70
2
From 313 to
323
and from 323
to 313
γ -form
65
Fig. 3.11 Solubility curves
for α -form and γ -form in the
ternary phase diagram and
operation point trajectories
of Method D (Run 7), and
temperature profile of Run 7
0
0.2
0.4
0.6
0.8
1
0
0.1
0.2
0.3
Heptane w H [mass fraction]
IMC w
I [mass fraction]
γ-form solubility
α'-form solubility
Operation point trajectory
Calculated result
Experimental data
0
50
100
310
320
330
340
Time θ [min]
Temp. T [K]
In Run 8, the solution was heated by 10 K/h, and solution temperature was kept
at 323 K for 30 min, and then it was cooled by 20 K/h for the last 30 min of a batch
operation time (Fig. 3.12). Actual solution composition could be maintained in the
region between α
-form and γ -form, and γ -form was obtained selectively. Thus,
the particular temperature operation integrating the suitable temperature change was