

62
H. Takiyama
Table 3.1 Comparison of
operating period (crystallizer
volume = 1000 mL, w H =
0.4)
P H (g/s)
Operating period (h)
0.01
4.2
0.03
1.4
0.1
0.4
operation point exceeds the solubility of α-form. From the simulation using the
proposed model, the anti-solvent feed rate conditions that an operation point does
not exceed the solubility of α-form can be decided.
3.4.4 Operation Strategies of Anti-solvent Addition Rate
From the simulation results, when anti-solvent composition of mixed solution
increased, it was clear that the driving force generated by addition of anti-solvent
was consumed immediately. From these results, it is possible to increase the feed
rate of anti-solvent in the latter half of anti-solvent crystallization operation, and it is
expected that operating period can be shortened. Based on the result of P H = 0.03,
the simulation result under the conditions in which the feed rate of the anti-solvent
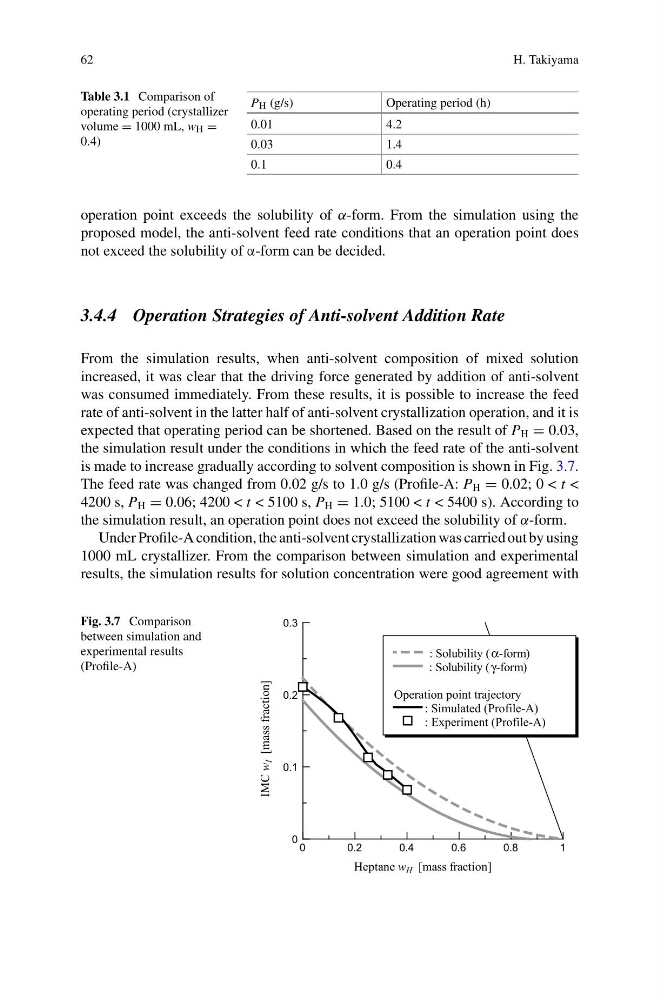
is made to increase gradually according to solvent composition is shown in Fig. 3.7.
The feed rate was changed from 0.02 g/s to 1.0 g/s (Profile-A: P H = 0.02; 0 < t <
4200 s, P H = 0.06; 4200 < t < 5100 s, P H = 1.0; 5100 < t < 5400 s). According to
the simulation result, an operation point does not exceed the solubility of α-form.
Under Profile-A condition, the anti-solvent crystallization was carried out by using
1000 mL crystallizer. From the comparison between simulation and experimental
results, the simulation results for solution concentration were good agreement with
Fig. 3.7 Comparison
between simulation and
experimental results
(Profile-A)
0
0.2
0.4
0.6
0.8
1
0
0.1
0.2
0.3
: Solubility ( α-form)
: Solubility ( γ-form)
Operation point trajectory
: Simulated (Profile-A)
: Experiment (Profile-A)
IMC w
I [mass fraction]
Heptane w H [mass fraction]
H. Takiyama
Table 3.1 Comparison of
operating period (crystallizer
volume = 1000 mL, w H =
0.4)
P H (g/s)
Operating period (h)
0.01
4.2
0.03
1.4
0.1
0.4
operation point exceeds the solubility of α-form. From the simulation using the
proposed model, the anti-solvent feed rate conditions that an operation point does
not exceed the solubility of α-form can be decided.
3.4.4 Operation Strategies of Anti-solvent Addition Rate
From the simulation results, when anti-solvent composition of mixed solution
increased, it was clear that the driving force generated by addition of anti-solvent
was consumed immediately. From these results, it is possible to increase the feed
rate of anti-solvent in the latter half of anti-solvent crystallization operation, and it is
expected that operating period can be shortened. Based on the result of P H = 0.03,
the simulation result under the conditions in which the feed rate of the anti-solvent
is made to increase gradually according to solvent composition is shown in Fig. 3.7.
The feed rate was changed from 0.02 g/s to 1.0 g/s (Profile-A: P H = 0.02; 0 < t <
4200 s, P H = 0.06; 4200 < t < 5100 s, P H = 1.0; 5100 < t < 5400 s). According to
the simulation result, an operation point does not exceed the solubility of α-form.
Under Profile-A condition, the anti-solvent crystallization was carried out by using
1000 mL crystallizer. From the comparison between simulation and experimental
results, the simulation results for solution concentration were good agreement with
Fig. 3.7 Comparison
between simulation and
experimental results
(Profile-A)
0
0.2
0.4
0.6
0.8
1
0
0.1
0.2
0.3
: Solubility ( α-form)
: Solubility ( γ-form)
Operation point trajectory
: Simulated (Profile-A)
: Experiment (Profile-A)
IMC w
I [mass fraction]
Heptane w H [mass fraction]