

3 Anti-solvent Crystallization Method for Production …
61
The IMC concentration change of the solution was predicted from the simulation
result. The operation model is as follows.
dW
dt
+
dM
dt
= P H
(3.5)
dW
dt
+ M
dw
dt
+ w
dM
dt
= 0
(3.6)
w H (t) =
∫
t
0 P H dt
Mw + M 0 − M 0 w 0 + ∫
t
0 P H dt
(3.7)
Equation (3.5) is total mass balance of semi-batch operation for anti-solvent crystallization. Equation (3.6) is IMC component mass balance and Eq. (3.7) is heptane
composition in the solution at time t.
3.4.3 Simulation Results Under the Condition of Isothermal
The solution concentration (operation point) simulation which changed the feed rate
of anti-solvent during crystallization was carried out, and the results of solution
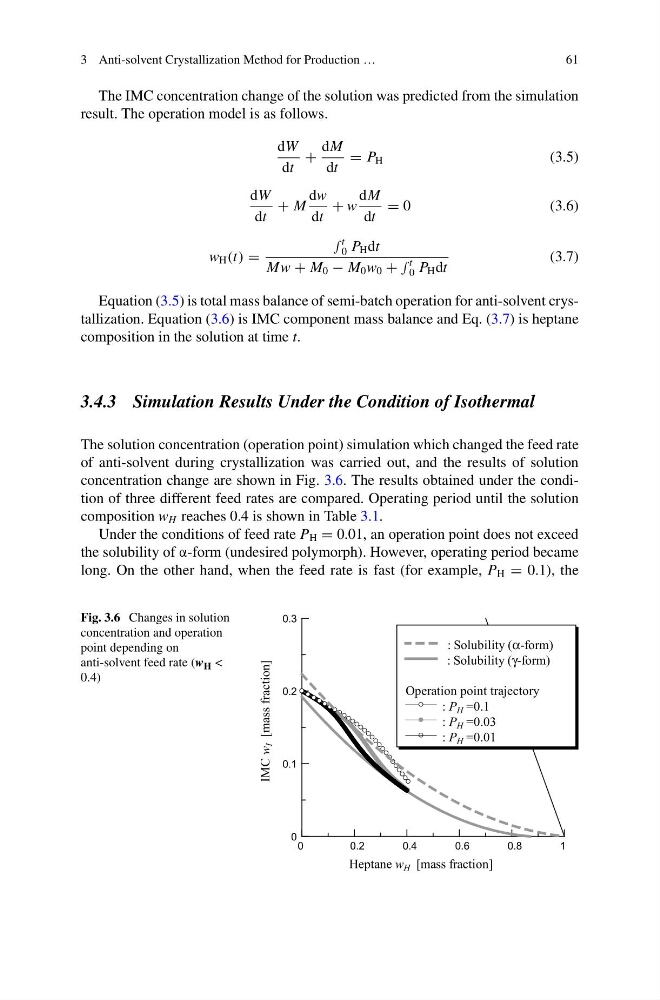
concentration change are shown in Fig. 3.6. The results obtained under the condition of three different feed rates are compared. Operating period until the solution
composition w H reaches 0.4 is shown in Table 3.1.
Under the conditions of feed rate P H = 0.01, an operation point does not exceed
the solubility of α-form (undesired polymorph). However, operating period became
long. On the other hand, when the feed rate is fast (for example, P H = 0.1), the
Fig. 3.6 Changes in solution
concentration and operation
point depending on
anti-solvent feed rate (w H <
0.4)
0
0.2
0.4
0.6
0.8
1
0
0.1
0.2
0.3
: Solubility (α-form)
: Solubility (γ-form)
Heptane w H [mass fraction]
IMC w
I [mass fraction]
Operation point trajectory
: P H =0.1
: P H =0.03
: P H =0.01
61
The IMC concentration change of the solution was predicted from the simulation
result. The operation model is as follows.
dW
dt
+
dM
dt
= P H
(3.5)
dW
dt
+ M
dw
dt
+ w
dM
dt
= 0
(3.6)
w H (t) =
∫
t
0 P H dt
Mw + M 0 − M 0 w 0 + ∫
t
0 P H dt
(3.7)
Equation (3.5) is total mass balance of semi-batch operation for anti-solvent crystallization. Equation (3.6) is IMC component mass balance and Eq. (3.7) is heptane
composition in the solution at time t.
3.4.3 Simulation Results Under the Condition of Isothermal
The solution concentration (operation point) simulation which changed the feed rate
of anti-solvent during crystallization was carried out, and the results of solution
concentration change are shown in Fig. 3.6. The results obtained under the condition of three different feed rates are compared. Operating period until the solution
composition w H reaches 0.4 is shown in Table 3.1.
Under the conditions of feed rate P H = 0.01, an operation point does not exceed
the solubility of α-form (undesired polymorph). However, operating period became
long. On the other hand, when the feed rate is fast (for example, P H = 0.1), the
Fig. 3.6 Changes in solution
concentration and operation
point depending on
anti-solvent feed rate (w H <
0.4)
0
0.2
0.4
0.6
0.8
1
0
0.1
0.2
0.3
: Solubility (α-form)
: Solubility (γ-form)
Heptane w H [mass fraction]
IMC w
I [mass fraction]
Operation point trajectory
: P H =0.1
: P H =0.03
: P H =0.01