

2 Direct Visualization of Crystal Formation and Growth …
47
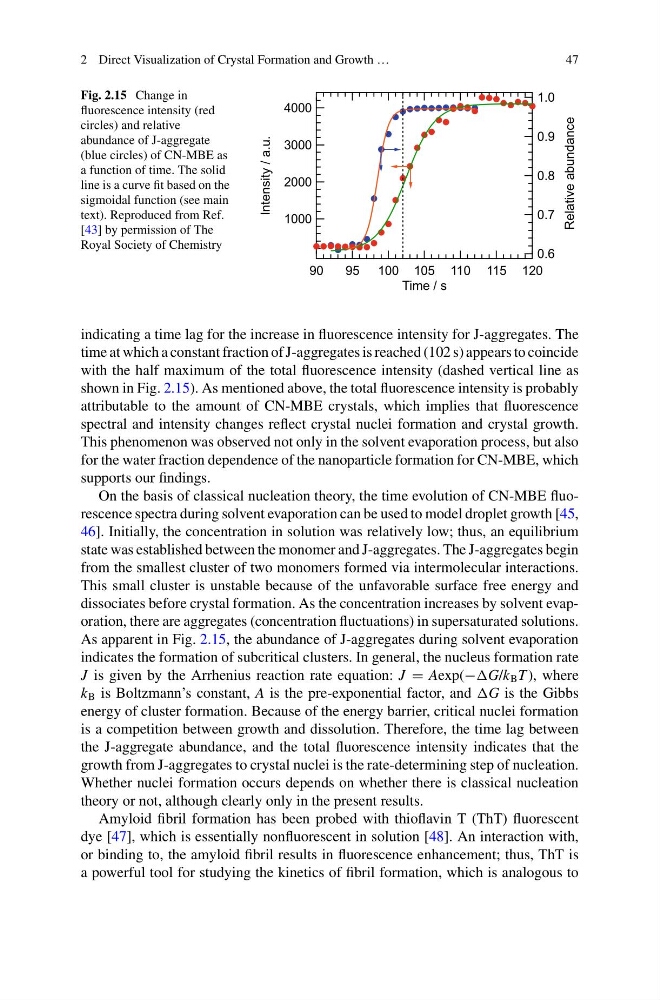
Fig. 2.15 Change in
fluorescence intensity (red
circles) and relative
abundance of J-aggregate
(blue circles) of CN-MBE as
a function of time. The solid
line is a curve fit based on the
sigmoidal function (see main
text). Reproduced from Ref.
[43] by permission of The
Royal Society of Chemistry
1.0
0.9
0.8
0.7
0.6
Relative abundance
120
115
110
105
100
95
90
Time / s
4000
3000
2000
1000
Intensity
/ a.u.
indicating a time lag for the increase in fluorescence intensity for J-aggregates. The
time at which a constant fraction of J-aggregates is reached (102 s) appears to coincide
with the half maximum of the total fluorescence intensity (dashed vertical line as
shown in Fig. 2.15). As mentioned above, the total fluorescence intensity is probably
attributable to the amount of CN-MBE crystals, which implies that fluorescence
spectral and intensity changes reflect crystal nuclei formation and crystal growth.
This phenomenon was observed not only in the solvent evaporation process, but also
for the water fraction dependence of the nanoparticle formation for CN-MBE, which
supports our findings.
On the basis of classical nucleation theory, the time evolution of CN-MBE fluorescence spectra during solvent evaporation can be used to model droplet growth [45,
46]. Initially, the concentration in solution was relatively low; thus, an equilibrium
state was established between the monomer and J-aggregates. The J-aggregates begin
from the smallest cluster of two monomers formed via intermolecular interactions.
This small cluster is unstable because of the unfavorable surface free energy and
dissociates before crystal formation. As the concentration increases by solvent evaporation, there are aggregates (concentration fluctuations) in supersaturated solutions.
As apparent in Fig. 2.15, the abundance of J-aggregates during solvent evaporation
indicates the formation of subcritical clusters. In general, the nucleus formation rate
J is given by the Arrhenius reaction rate equation: J = Aexp(− B T ), where
k B is Boltzmann’s constant, A is the pre-exponential factor, and is the Gibbs
energy of cluster formation. Because of the energy barrier, critical nuclei formation
is a competition between growth and dissolution. Therefore, the time lag between
the J-aggregate abundance, and the total fluorescence intensity indicates that the
growth from J-aggregates to crystal nuclei is the rate-determining step of nucleation.
Whether nuclei formation occurs depends on whether there is classical nucleation
theory or not, although clearly only in the present results.
Amyloid fibril formation has been probed with thioflavin T (ThT) fluorescent
dye [47], which is essentially nonfluorescent in solution [48]. An interaction with,
or binding to, the amyloid fibril results in fluorescence enhancement; thus, ThT is
a powerful tool for studying the kinetics of fibril formation, which is analogous to
47
Fig. 2.15 Change in
fluorescence intensity (red
circles) and relative
abundance of J-aggregate
(blue circles) of CN-MBE as
a function of time. The solid
line is a curve fit based on the
sigmoidal function (see main
text). Reproduced from Ref.
[43] by permission of The
Royal Society of Chemistry
1.0
0.9
0.8
0.7
0.6
Relative abundance
120
115
110
105
100
95
90
Time / s
4000
3000
2000
1000
Intensity
/ a.u.
indicating a time lag for the increase in fluorescence intensity for J-aggregates. The
time at which a constant fraction of J-aggregates is reached (102 s) appears to coincide
with the half maximum of the total fluorescence intensity (dashed vertical line as
shown in Fig. 2.15). As mentioned above, the total fluorescence intensity is probably
attributable to the amount of CN-MBE crystals, which implies that fluorescence
spectral and intensity changes reflect crystal nuclei formation and crystal growth.
This phenomenon was observed not only in the solvent evaporation process, but also
for the water fraction dependence of the nanoparticle formation for CN-MBE, which
supports our findings.
On the basis of classical nucleation theory, the time evolution of CN-MBE fluorescence spectra during solvent evaporation can be used to model droplet growth [45,
46]. Initially, the concentration in solution was relatively low; thus, an equilibrium
state was established between the monomer and J-aggregates. The J-aggregates begin
from the smallest cluster of two monomers formed via intermolecular interactions.
This small cluster is unstable because of the unfavorable surface free energy and
dissociates before crystal formation. As the concentration increases by solvent evaporation, there are aggregates (concentration fluctuations) in supersaturated solutions.
As apparent in Fig. 2.15, the abundance of J-aggregates during solvent evaporation
indicates the formation of subcritical clusters. In general, the nucleus formation rate
J is given by the Arrhenius reaction rate equation: J = Aexp(− B T ), where
k B is Boltzmann’s constant, A is the pre-exponential factor, and is the Gibbs
energy of cluster formation. Because of the energy barrier, critical nuclei formation
is a competition between growth and dissolution. Therefore, the time lag between
the J-aggregate abundance, and the total fluorescence intensity indicates that the
growth from J-aggregates to crystal nuclei is the rate-determining step of nucleation.
Whether nuclei formation occurs depends on whether there is classical nucleation
theory or not, although clearly only in the present results.
Amyloid fibril formation has been probed with thioflavin T (ThT) fluorescent
dye [47], which is essentially nonfluorescent in solution [48]. An interaction with,
or binding to, the amyloid fibril results in fluorescence enhancement; thus, ThT is
a powerful tool for studying the kinetics of fibril formation, which is analogous to