

2 Direct Visualization of Crystal Formation and Growth …
45
1.2
1.0
0.8
0.6
0.4
0.2
0.0
Intensity
/ a.u.
650
600
550
500
450
400
350
Wavelength / nm
0.0005
2.0 mol%
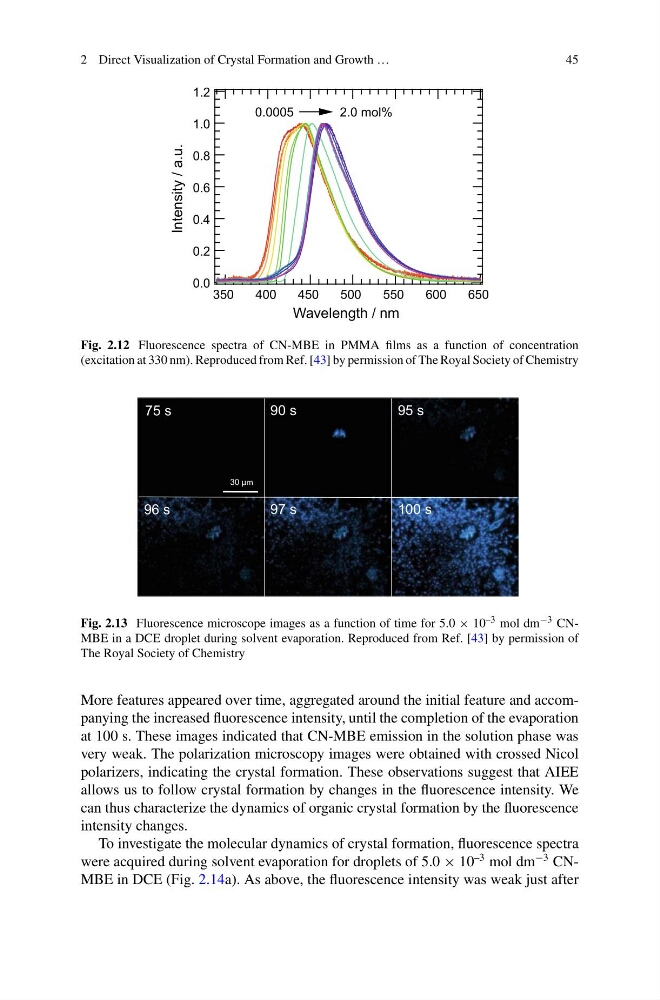
Fig. 2.12 Fluorescence spectra of CN-MBE in PMMA films as a function of concentration
(excitation at 330 nm). Reproduced from Ref. [43] by permission of The Royal Society of Chemistry
30 µm
75 s
90 s
95 s
96 s
97 s
100 s
Fig. 2.13 Fluorescence microscope images as a function of time for 5.0 × 10 –3 mol dm −3 CNMBE in a DCE droplet during solvent evaporation. Reproduced from Ref. [43] by permission of
The Royal Society of Chemistry
More features appeared over time, aggregated around the initial feature and accompanying the increased fluorescence intensity, until the completion of the evaporation
at 100 s. These images indicated that CN-MBE emission in the solution phase was
very weak. The polarization microscopy images were obtained with crossed Nicol
polarizers, indicating the crystal formation. These observations suggest that AIEE
allows us to follow crystal formation by changes in the fluorescence intensity. We
can thus characterize the dynamics of organic crystal formation by the fluorescence
intensity changes.
To investigate the molecular dynamics of crystal formation, fluorescence spectra
were acquired during solvent evaporation for droplets of 5.0 × 10
–3 mol dm
−3 CNMBE in DCE (Fig. 2.14a). As above, the fluorescence intensity was weak just after
45
1.2
1.0
0.8
0.6
0.4
0.2
0.0
Intensity
/ a.u.
650
600
550
500
450
400
350
Wavelength / nm
0.0005
2.0 mol%
Fig. 2.12 Fluorescence spectra of CN-MBE in PMMA films as a function of concentration
(excitation at 330 nm). Reproduced from Ref. [43] by permission of The Royal Society of Chemistry
30 µm
75 s
90 s
95 s
96 s
97 s
100 s
Fig. 2.13 Fluorescence microscope images as a function of time for 5.0 × 10 –3 mol dm −3 CNMBE in a DCE droplet during solvent evaporation. Reproduced from Ref. [43] by permission of
The Royal Society of Chemistry
More features appeared over time, aggregated around the initial feature and accompanying the increased fluorescence intensity, until the completion of the evaporation
at 100 s. These images indicated that CN-MBE emission in the solution phase was
very weak. The polarization microscopy images were obtained with crossed Nicol
polarizers, indicating the crystal formation. These observations suggest that AIEE
allows us to follow crystal formation by changes in the fluorescence intensity. We
can thus characterize the dynamics of organic crystal formation by the fluorescence
intensity changes.
To investigate the molecular dynamics of crystal formation, fluorescence spectra
were acquired during solvent evaporation for droplets of 5.0 × 10
–3 mol dm
−3 CNMBE in DCE (Fig. 2.14a). As above, the fluorescence intensity was weak just after