

20 Twenty-Five Years’ History, Mechanism, and Generality …
415
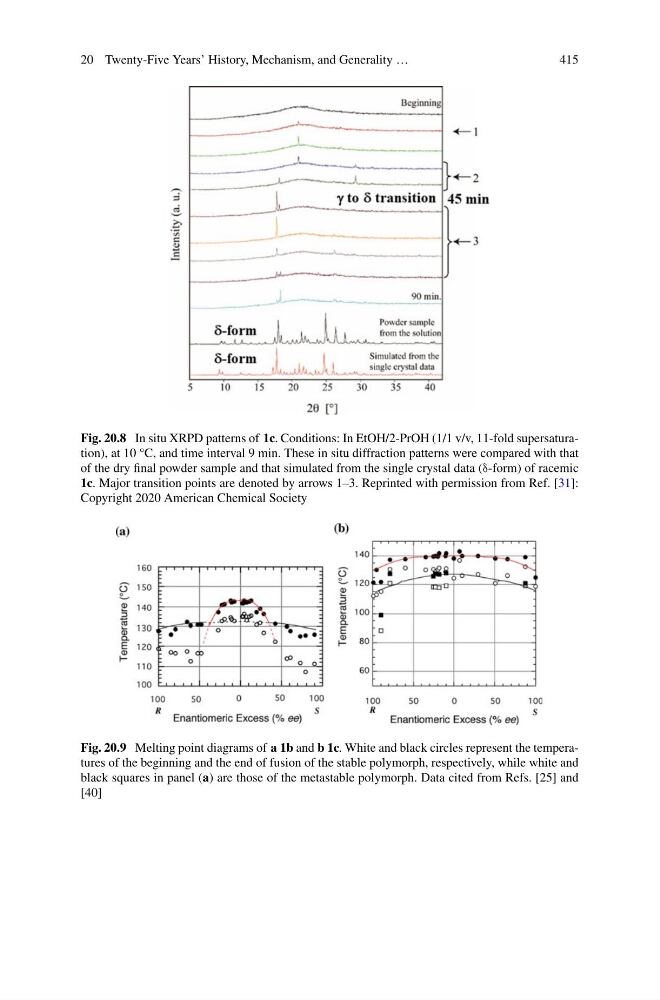
Fig. 20.8 In situ XRPD patterns of 1c. Conditions: In EtOH/2-PrOH (1/1 v/v, 11-fold supersaturation), at 10 °C, and time interval 9 min. These in situ diffraction patterns were compared with that
of the dry final powder sample and that simulated from the single crystal data (δ-form) of racemic
1c. Major transition points are denoted by arrows 1–3. Reprinted with permission from Ref. [31]:
Copyright 2020 American Chemical Society
Fig. 20.9 Melting point diagrams of a 1b and b 1c. White and black circles represent the temperatures of the beginning and the end of fusion of the stable polymorph, respectively, while white and
black squares in panel (a) are those of the metastable polymorph. Data cited from Refs. [25] and
[40]
415
Fig. 20.8 In situ XRPD patterns of 1c. Conditions: In EtOH/2-PrOH (1/1 v/v, 11-fold supersaturation), at 10 °C, and time interval 9 min. These in situ diffraction patterns were compared with that
of the dry final powder sample and that simulated from the single crystal data (δ-form) of racemic
1c. Major transition points are denoted by arrows 1–3. Reprinted with permission from Ref. [31]:
Copyright 2020 American Chemical Society
Fig. 20.9 Melting point diagrams of a 1b and b 1c. White and black circles represent the temperatures of the beginning and the end of fusion of the stable polymorph, respectively, while white and
black squares in panel (a) are those of the metastable polymorph. Data cited from Refs. [25] and
[40]