

414
R. Tamura et al.
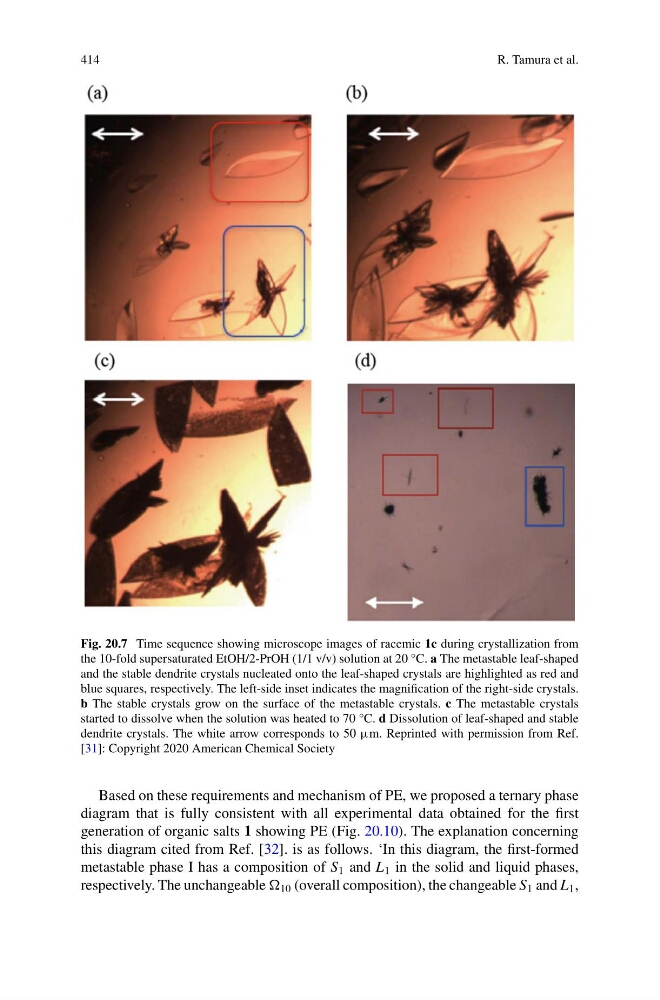
Fig. 20.7 Time sequence showing microscope images of racemic 1c during crystallization from
the 10-fold supersaturated EtOH/2-PrOH (1/1 v/v) solution at 20 °C. a The metastable leaf-shaped
and the stable dendrite crystals nucleated onto the leaf-shaped crystals are highlighted as red and
blue squares, respectively. The left-side inset indicates the magnification of the right-side crystals.
b The stable crystals grow on the surface of the metastable crystals. c The metastable crystals
started to dissolve when the solution was heated to 70 °C. d Dissolution of leaf-shaped and stable
dendrite crystals. The white arrow corresponds to 50 μm. Reprinted with permission from Ref.
[31]: Copyright 2020 American Chemical Society
Based on these requirements and mechanism of PE, we proposed a ternary phase
diagram that is fully consistent with all experimental data obtained for the first
generation of organic salts 1 showing PE (Fig. 20.10). The explanation concerning
this diagram cited from Ref. [32]. is as follows. ‘In this diagram, the first-formed
metastable phase I has a composition of S 1 and L 1 in the solid and liquid phases,
respectively. The unchangeable 10 (overall composition), the changeable S 1 and L 1 ,
R. Tamura et al.
Fig. 20.7 Time sequence showing microscope images of racemic 1c during crystallization from
the 10-fold supersaturated EtOH/2-PrOH (1/1 v/v) solution at 20 °C. a The metastable leaf-shaped
and the stable dendrite crystals nucleated onto the leaf-shaped crystals are highlighted as red and
blue squares, respectively. The left-side inset indicates the magnification of the right-side crystals.
b The stable crystals grow on the surface of the metastable crystals. c The metastable crystals
started to dissolve when the solution was heated to 70 °C. d Dissolution of leaf-shaped and stable
dendrite crystals. The white arrow corresponds to 50 μm. Reprinted with permission from Ref.
[31]: Copyright 2020 American Chemical Society
Based on these requirements and mechanism of PE, we proposed a ternary phase
diagram that is fully consistent with all experimental data obtained for the first
generation of organic salts 1 showing PE (Fig. 20.10). The explanation concerning
this diagram cited from Ref. [32]. is as follows. ‘In this diagram, the first-formed
metastable phase I has a composition of S 1 and L 1 in the solid and liquid phases,
respectively. The unchangeable 10 (overall composition), the changeable S 1 and L 1 ,