

416
R. Tamura et al.
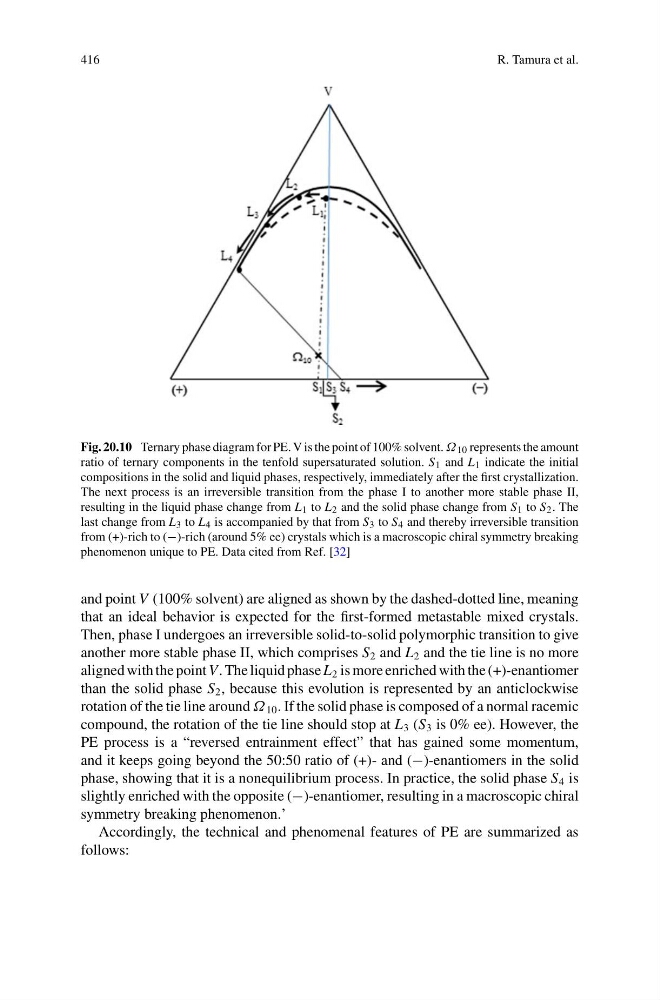
Fig. 20.10 Ternary phase diagram for PE. V is the point of 100% solvent. Ω 10 represents the amount
ratio of ternary components in the tenfold supersaturated solution. S 1 and L 1 indicate the initial
compositions in the solid and liquid phases, respectively, immediately after the first crystallization.
The next process is an irreversible transition from the phase I to another more stable phase II,
resulting in the liquid phase change from L 1 to L 2 and the solid phase change from S 1 to S 2 . The
last change from L 3 to L 4 is accompanied by that from S 3 to S 4 and thereby irreversible transition
from (+)-rich to (−)-rich (around 5% ee) crystals which is a macroscopic chiral symmetry breaking
phenomenon unique to PE. Data cited from Ref. [32]
and point V (100% solvent) are aligned as shown by the dashed-dotted line, meaning
that an ideal behavior is expected for the first-formed metastable mixed crystals.
Then, phase I undergoes an irreversible solid-to-solid polymorphic transition to give
another more stable phase II, which comprises S 2 and L 2 and the tie line is no more
aligned with the point V. The liquid phase L 2 is more enriched with the (+)-enantiomer
than the solid phase S 2 , because this evolution is represented by an anticlockwise
rotation of the tie line around Ω 10 . If the solid phase is composed of a normal racemic
compound, the rotation of the tie line should stop at L 3 (S 3 is 0% ee). However, the
PE process is a “reversed entrainment effect” that has gained some momentum,
and it keeps going beyond the 50:50 ratio of (+)- and (−)-enantiomers in the solid
phase, showing that it is a nonequilibrium process. In practice, the solid phase S 4 is
slightly enriched with the opposite (−)-enantiomer, resulting in a macroscopic chiral
symmetry breaking phenomenon.’
Accordingly, the technical and phenomenal features of PE are summarized as
follows:
R. Tamura et al.
Fig. 20.10 Ternary phase diagram for PE. V is the point of 100% solvent. Ω 10 represents the amount
ratio of ternary components in the tenfold supersaturated solution. S 1 and L 1 indicate the initial
compositions in the solid and liquid phases, respectively, immediately after the first crystallization.
The next process is an irreversible transition from the phase I to another more stable phase II,
resulting in the liquid phase change from L 1 to L 2 and the solid phase change from S 1 to S 2 . The
last change from L 3 to L 4 is accompanied by that from S 3 to S 4 and thereby irreversible transition
from (+)-rich to (−)-rich (around 5% ee) crystals which is a macroscopic chiral symmetry breaking
phenomenon unique to PE. Data cited from Ref. [32]
and point V (100% solvent) are aligned as shown by the dashed-dotted line, meaning
that an ideal behavior is expected for the first-formed metastable mixed crystals.
Then, phase I undergoes an irreversible solid-to-solid polymorphic transition to give
another more stable phase II, which comprises S 2 and L 2 and the tie line is no more
aligned with the point V. The liquid phase L 2 is more enriched with the (+)-enantiomer
than the solid phase S 2 , because this evolution is represented by an anticlockwise
rotation of the tie line around Ω 10 . If the solid phase is composed of a normal racemic
compound, the rotation of the tie line should stop at L 3 (S 3 is 0% ee). However, the
PE process is a “reversed entrainment effect” that has gained some momentum,
and it keeps going beyond the 50:50 ratio of (+)- and (−)-enantiomers in the solid
phase, showing that it is a nonequilibrium process. In practice, the solid phase S 4 is
slightly enriched with the opposite (−)-enantiomer, resulting in a macroscopic chiral
symmetry breaking phenomenon.’
Accordingly, the technical and phenomenal features of PE are summarized as
follows: