

412
R. Tamura et al.
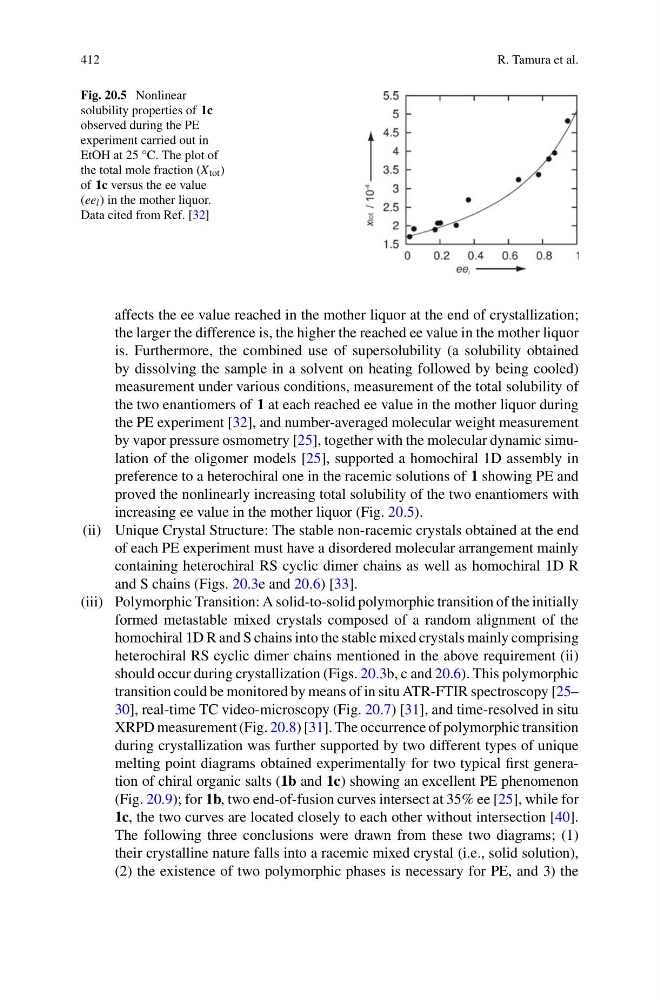
Fig. 20.5 Nonlinear
solubility properties of 1c
observed during the PE
experiment carried out in
EtOH at 25 °C. The plot of
the total mole fraction (X tot )
of 1c versus the ee value
(ee l ) in the mother liquor.
Data cited from Ref. [32]
affects the ee value reached in the mother liquor at the end of crystallization;
the larger the difference is, the higher the reached ee value in the mother liquor
is. Furthermore, the combined use of supersolubility (a solubility obtained
by dissolving the sample in a solvent on heating followed by being cooled)
measurement under various conditions, measurement of the total solubility of
the two enantiomers of 1 at each reached ee value in the mother liquor during
the PE experiment [32], and number-averaged molecular weight measurement
by vapor pressure osmometry [25], together with the molecular dynamic simulation of the oligomer models [25], supported a homochiral 1D assembly in
preference to a heterochiral one in the racemic solutions of 1 showing PE and
proved the nonlinearly increasing total solubility of the two enantiomers with
increasing ee value in the mother liquor (Fig. 20.5).
(ii) Unique Crystal Structure: The stable non-racemic crystals obtained at the end
of each PE experiment must have a disordered molecular arrangement mainly
containing heterochiral RS cyclic dimer chains as well as homochiral 1D R
and S chains (Figs. 20.3e and 20.6) [33].
(iii) Polymorphic Transition: A solid-to-solid polymorphic transition of the initially
formed metastable mixed crystals composed of a random alignment of the
homochiral 1D R and S chains into the stable mixed crystals mainly comprising
heterochiral RS cyclic dimer chains mentioned in the above requirement (ii)
should occur during crystallization (Figs. 20.3b, c and 20.6). This polymorphic
transition could be monitored by means of in situ ATR-FTIR spectroscopy [25–
30], real-time TC video-microscopy (Fig. 20.7) [31], and time-resolved in situ
XRPD measurement (Fig. 20.8) [31]. The occurrence of polymorphic transition
during crystallization was further supported by two different types of unique
melting point diagrams obtained experimentally for two typical first generation of chiral organic salts (1b and 1c) showing an excellent PE phenomenon
(Fig. 20.9); for 1b, two end-of-fusion curves intersect at 35% ee [25], while for
1c, the two curves are located closely to each other without intersection [40].
The following three conclusions were drawn from these two diagrams; (1)
their crystalline nature falls into a racemic mixed crystal (i.e., solid solution),
(2) the existence of two polymorphic phases is necessary for PE, and 3) the
R. Tamura et al.
Fig. 20.5 Nonlinear
solubility properties of 1c
observed during the PE
experiment carried out in
EtOH at 25 °C. The plot of
the total mole fraction (X tot )
of 1c versus the ee value
(ee l ) in the mother liquor.
Data cited from Ref. [32]
affects the ee value reached in the mother liquor at the end of crystallization;
the larger the difference is, the higher the reached ee value in the mother liquor
is. Furthermore, the combined use of supersolubility (a solubility obtained
by dissolving the sample in a solvent on heating followed by being cooled)
measurement under various conditions, measurement of the total solubility of
the two enantiomers of 1 at each reached ee value in the mother liquor during
the PE experiment [32], and number-averaged molecular weight measurement
by vapor pressure osmometry [25], together with the molecular dynamic simulation of the oligomer models [25], supported a homochiral 1D assembly in
preference to a heterochiral one in the racemic solutions of 1 showing PE and
proved the nonlinearly increasing total solubility of the two enantiomers with
increasing ee value in the mother liquor (Fig. 20.5).
(ii) Unique Crystal Structure: The stable non-racemic crystals obtained at the end
of each PE experiment must have a disordered molecular arrangement mainly
containing heterochiral RS cyclic dimer chains as well as homochiral 1D R
and S chains (Figs. 20.3e and 20.6) [33].
(iii) Polymorphic Transition: A solid-to-solid polymorphic transition of the initially
formed metastable mixed crystals composed of a random alignment of the
homochiral 1D R and S chains into the stable mixed crystals mainly comprising
heterochiral RS cyclic dimer chains mentioned in the above requirement (ii)
should occur during crystallization (Figs. 20.3b, c and 20.6). This polymorphic
transition could be monitored by means of in situ ATR-FTIR spectroscopy [25–
30], real-time TC video-microscopy (Fig. 20.7) [31], and time-resolved in situ
XRPD measurement (Fig. 20.8) [31]. The occurrence of polymorphic transition
during crystallization was further supported by two different types of unique
melting point diagrams obtained experimentally for two typical first generation of chiral organic salts (1b and 1c) showing an excellent PE phenomenon
(Fig. 20.9); for 1b, two end-of-fusion curves intersect at 35% ee [25], while for
1c, the two curves are located closely to each other without intersection [40].
The following three conclusions were drawn from these two diagrams; (1)
their crystalline nature falls into a racemic mixed crystal (i.e., solid solution),
(2) the existence of two polymorphic phases is necessary for PE, and 3) the