

14 Luminescent Crystal–Control of Excited-State …
289
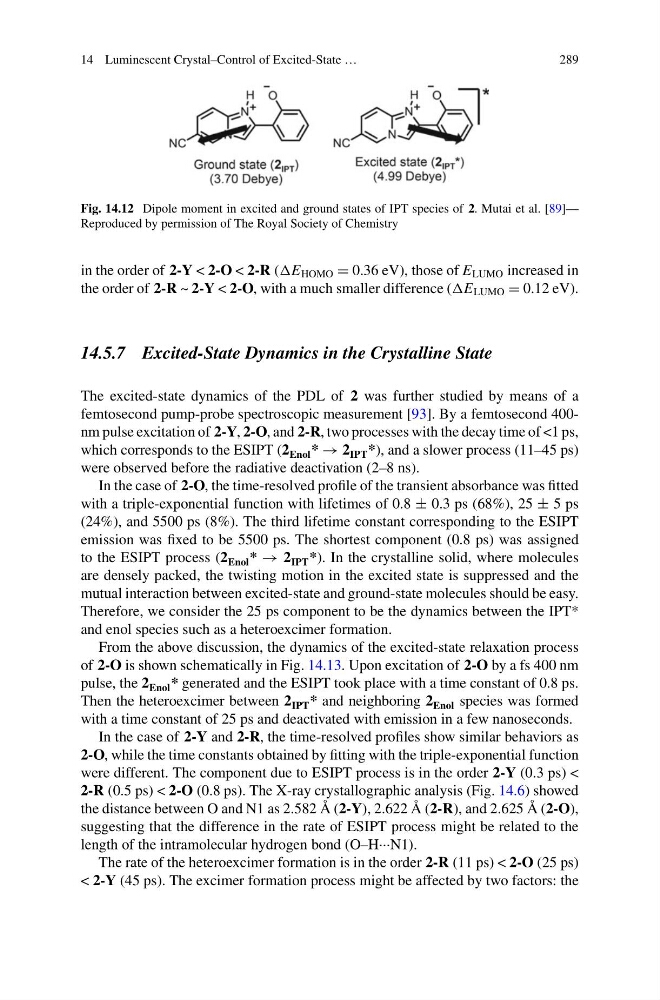
Fig. 14.12 Dipole moment in excited and ground states of IPT species of 2. Mutai et al. [89]—
Reproduced by permission of The Royal Society of Chemistry
in the order of 2-Y < 2-O < 2-R (E HOMO = 0.36 eV), those of E LUMO increased in
the order of 2-R ~ 2-Y < 2-O, with a much smaller difference (E LUMO = 0.12 eV).
14.5.7 Excited-State Dynamics in the Crystalline State
The excited-state dynamics of the PDL of 2 was further studied by means of a
femtosecond pump-probe spectroscopic measurement [93]. By a femtosecond 400nm pulse excitation of 2-Y, 2-O, and 2-R, two processes with the decay time of <1 ps,
which corresponds to the ESIPT (2 Enol * → 2 IPT *), and a slower process (11–45 ps)
were observed before the radiative deactivation (2–8 ns).
In the case of 2-O, the time-resolved profile of the transient absorbance was fitted
with a triple-exponential function with lifetimes of 0.8 ± 0.3 ps (68%), 25 ± 5 ps
(24%), and 5500 ps (8%). The third lifetime constant corresponding to the ESIPT
emission was fixed to be 5500 ps. The shortest component (0.8 ps) was assigned
to the ESIPT process (2 Enol * → 2 IPT *). In the crystalline solid, where molecules
are densely packed, the twisting motion in the excited state is suppressed and the
mutual interaction between excited-state and ground-state molecules should be easy.
Therefore, we consider the 25 ps component to be the dynamics between the IPT*
and enol species such as a heteroexcimer formation.
From the above discussion, the dynamics of the excited-state relaxation process
of 2-O is shown schematically in Fig. 14.13. Upon excitation of 2-O by a fs 400 nm
pulse, the 2 Enol * generated and the ESIPT took place with a time constant of 0.8 ps.
Then the heteroexcimer between 2 IPT * and neighboring 2 Enol species was formed
with a time constant of 25 ps and deactivated with emission in a few nanoseconds.
In the case of 2-Y and 2-R, the time-resolved profiles show similar behaviors as
2-O, while the time constants obtained by fitting with the triple-exponential function
were different. The component due to ESIPT process is in the order 2-Y (0.3 ps) <
2-R (0.5 ps) < 2-O (0.8 ps). The X-ray crystallographic analysis (Fig. 14.6) showed
the distance between O and N1 as 2.582 Å (2-Y), 2.622 Å (2-R), and 2.625 Å (2-O),
suggesting that the difference in the rate of ESIPT process might be related to the
length of the intramolecular hydrogen bond (O–H···N1).
The rate of the heteroexcimer formation is in the order 2-R (11 ps) < 2-O (25 ps)
< 2-Y (45 ps). The excimer formation process might be affected by two factors: the
289
Fig. 14.12 Dipole moment in excited and ground states of IPT species of 2. Mutai et al. [89]—
Reproduced by permission of The Royal Society of Chemistry
in the order of 2-Y < 2-O < 2-R (E HOMO = 0.36 eV), those of E LUMO increased in
the order of 2-R ~ 2-Y < 2-O, with a much smaller difference (E LUMO = 0.12 eV).
14.5.7 Excited-State Dynamics in the Crystalline State
The excited-state dynamics of the PDL of 2 was further studied by means of a
femtosecond pump-probe spectroscopic measurement [93]. By a femtosecond 400nm pulse excitation of 2-Y, 2-O, and 2-R, two processes with the decay time of <1 ps,
which corresponds to the ESIPT (2 Enol * → 2 IPT *), and a slower process (11–45 ps)
were observed before the radiative deactivation (2–8 ns).
In the case of 2-O, the time-resolved profile of the transient absorbance was fitted
with a triple-exponential function with lifetimes of 0.8 ± 0.3 ps (68%), 25 ± 5 ps
(24%), and 5500 ps (8%). The third lifetime constant corresponding to the ESIPT
emission was fixed to be 5500 ps. The shortest component (0.8 ps) was assigned
to the ESIPT process (2 Enol * → 2 IPT *). In the crystalline solid, where molecules
are densely packed, the twisting motion in the excited state is suppressed and the
mutual interaction between excited-state and ground-state molecules should be easy.
Therefore, we consider the 25 ps component to be the dynamics between the IPT*
and enol species such as a heteroexcimer formation.
From the above discussion, the dynamics of the excited-state relaxation process
of 2-O is shown schematically in Fig. 14.13. Upon excitation of 2-O by a fs 400 nm
pulse, the 2 Enol * generated and the ESIPT took place with a time constant of 0.8 ps.
Then the heteroexcimer between 2 IPT * and neighboring 2 Enol species was formed
with a time constant of 25 ps and deactivated with emission in a few nanoseconds.
In the case of 2-Y and 2-R, the time-resolved profiles show similar behaviors as
2-O, while the time constants obtained by fitting with the triple-exponential function
were different. The component due to ESIPT process is in the order 2-Y (0.3 ps) <
2-R (0.5 ps) < 2-O (0.8 ps). The X-ray crystallographic analysis (Fig. 14.6) showed
the distance between O and N1 as 2.582 Å (2-Y), 2.622 Å (2-R), and 2.625 Å (2-O),
suggesting that the difference in the rate of ESIPT process might be related to the
length of the intramolecular hydrogen bond (O–H···N1).
The rate of the heteroexcimer formation is in the order 2-R (11 ps) < 2-O (25 ps)
< 2-Y (45 ps). The excimer formation process might be affected by two factors: the