

258
T. Onodera et al.
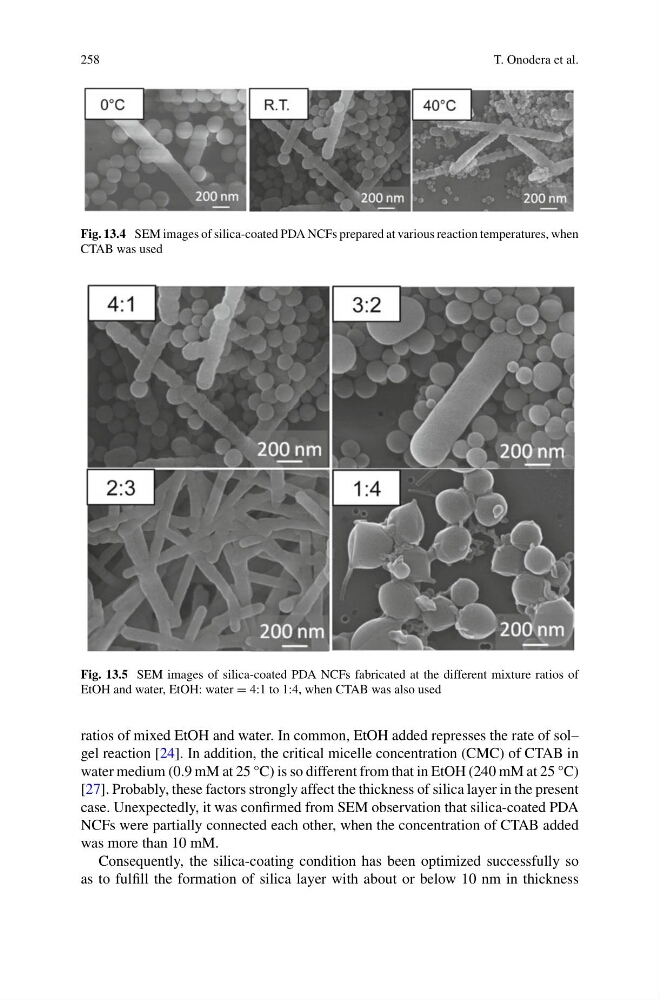
Fig. 13.4 SEM images of silica-coated PDA NCFs prepared at various reaction temperatures, when
CTAB was used
Fig. 13.5 SEM images of silica-coated PDA NCFs fabricated at the different mixture ratios of
EtOH and water, EtOH: water = 4:1 to 1:4, when CTAB was also used
ratios of mixed EtOH and water. In common, EtOH added represses the rate of sol–
gel reaction [24]. In addition, the critical micelle concentration (CMC) of CTAB in
water medium (0.9 mM at 25 °C) is so different from that in EtOH (240 mM at 25 °C)
[27]. Probably, these factors strongly affect the thickness of silica layer in the present
case. Unexpectedly, it was confirmed from SEM observation that silica-coated PDA
NCFs were partially connected each other, when the concentration of CTAB added
was more than 10 mM.
Consequently, the silica-coating condition has been optimized successfully so
as to fulfill the formation of silica layer with about or below 10 nm in thickness
T. Onodera et al.
Fig. 13.4 SEM images of silica-coated PDA NCFs prepared at various reaction temperatures, when
CTAB was used
Fig. 13.5 SEM images of silica-coated PDA NCFs fabricated at the different mixture ratios of
EtOH and water, EtOH: water = 4:1 to 1:4, when CTAB was also used
ratios of mixed EtOH and water. In common, EtOH added represses the rate of sol–
gel reaction [24]. In addition, the critical micelle concentration (CMC) of CTAB in
water medium (0.9 mM at 25 °C) is so different from that in EtOH (240 mM at 25 °C)
[27]. Probably, these factors strongly affect the thickness of silica layer in the present
case. Unexpectedly, it was confirmed from SEM observation that silica-coated PDA
NCFs were partially connected each other, when the concentration of CTAB added
was more than 10 mM.
Consequently, the silica-coating condition has been optimized successfully so
as to fulfill the formation of silica layer with about or below 10 nm in thickness