

16
K. D. M. Harris et al.
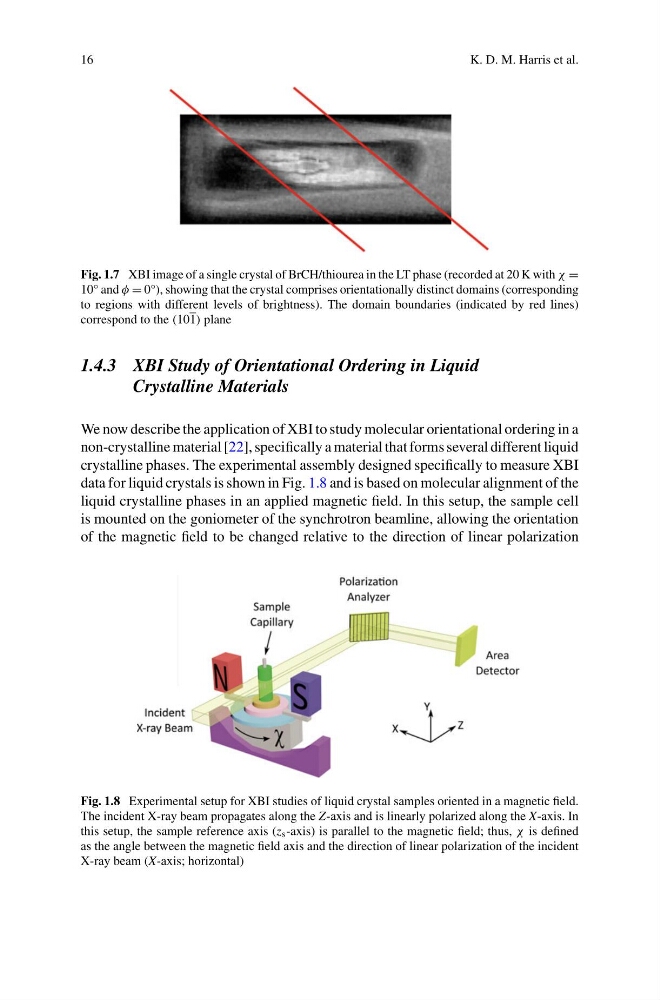
Fig. 1.7 XBI image of a single crystal of BrCH/thiourea in the LT phase (recorded at 20 K with χ =
10° and φ = 0°), showing that the crystal comprises orientationally distinct domains (corresponding
to regions with different levels of brightness). The domain boundaries (indicated by red lines)
correspond to the (101) plane
1.4.3 XBI Study of Orientational Ordering in Liquid
Crystalline Materials
We now describe the application of XBI to study molecular orientational ordering in a
non-crystalline material [22], specifically a material that forms several different liquid
crystalline phases. The experimental assembly designed specifically to measure XBI
data for liquid crystals is shown in Fig. 1.8 and is based on molecular alignment of the
liquid crystalline phases in an applied magnetic field. In this setup, the sample cell
is mounted on the goniometer of the synchrotron beamline, allowing the orientation
of the magnetic field to be changed relative to the direction of linear polarization
Fig. 1.8 Experimental setup for XBI studies of liquid crystal samples oriented in a magnetic field.
The incident X-ray beam propagates along the Z-axis and is linearly polarized along the X-axis. In
this setup, the sample reference axis (z s -axis) is parallel to the magnetic field; thus, χ is defined
as the angle between the magnetic field axis and the direction of linear polarization of the incident
X-ray beam (X-axis; horizontal)
K. D. M. Harris et al.
Fig. 1.7 XBI image of a single crystal of BrCH/thiourea in the LT phase (recorded at 20 K with χ =
10° and φ = 0°), showing that the crystal comprises orientationally distinct domains (corresponding
to regions with different levels of brightness). The domain boundaries (indicated by red lines)
correspond to the (101) plane
1.4.3 XBI Study of Orientational Ordering in Liquid
Crystalline Materials
We now describe the application of XBI to study molecular orientational ordering in a
non-crystalline material [22], specifically a material that forms several different liquid
crystalline phases. The experimental assembly designed specifically to measure XBI
data for liquid crystals is shown in Fig. 1.8 and is based on molecular alignment of the
liquid crystalline phases in an applied magnetic field. In this setup, the sample cell
is mounted on the goniometer of the synchrotron beamline, allowing the orientation
of the magnetic field to be changed relative to the direction of linear polarization
Fig. 1.8 Experimental setup for XBI studies of liquid crystal samples oriented in a magnetic field.
The incident X-ray beam propagates along the Z-axis and is linearly polarized along the X-axis. In
this setup, the sample reference axis (z s -axis) is parallel to the magnetic field; thus, χ is defined
as the angle between the magnetic field axis and the direction of linear polarization of the incident
X-ray beam (X-axis; horizontal)