

12
K. D. M. Harris et al.
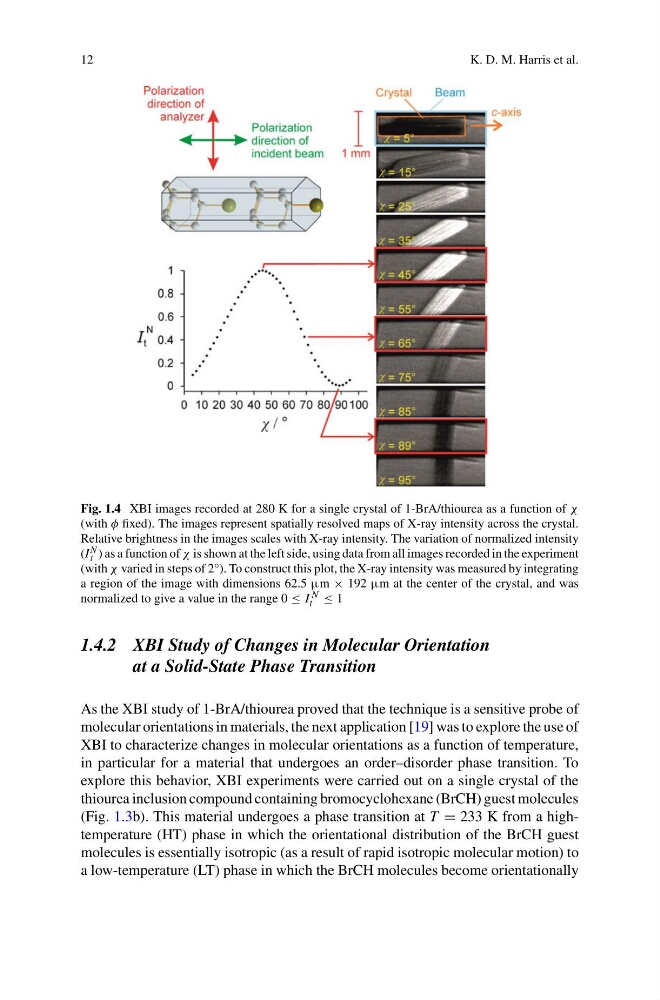
Fig. 1.4 XBI images recorded at 280 K for a single crystal of 1-BrA/thiourea as a function of χ
(with φ fixed). The images represent spatially resolved maps of X-ray intensity across the crystal.
Relative brightness in the images scales with X-ray intensity. The variation of normalized intensity
(I N
t ) as a function of χ is shown at the left side, using data from all images recorded in the experiment
(with χ varied in steps of 2°). To construct this plot, the X-ray intensity was measured by integrating
a region of the image with dimensions 62.5 μm × 192 μm at the center of the crystal, and was
normalized to give a value in the range 0 ≤ I N
t ≤ 1
1.4.2 XBI Study of Changes in Molecular Orientation
at a Solid-State Phase Transition
As the XBI study of 1-BrA/thiourea proved that the technique is a sensitive probe of
molecular orientations in materials, the next application [19] was to explore the use of
XBI to characterize changes in molecular orientations as a function of temperature,
in particular for a material that undergoes an order–disorder phase transition. To
explore this behavior, XBI experiments were carried out on a single crystal of the
thiourea inclusion compound containing bromocyclohexane (BrCH) guest molecules
(Fig. 1.3b). This material undergoes a phase transition at T = 233 K from a hightemperature (HT) phase in which the orientational distribution of the BrCH guest
molecules is essentially isotropic (as a result of rapid isotropic molecular motion) to
a low-temperature (LT) phase in which the BrCH molecules become orientationally
K. D. M. Harris et al.
Fig. 1.4 XBI images recorded at 280 K for a single crystal of 1-BrA/thiourea as a function of χ
(with φ fixed). The images represent spatially resolved maps of X-ray intensity across the crystal.
Relative brightness in the images scales with X-ray intensity. The variation of normalized intensity
(I N
t ) as a function of χ is shown at the left side, using data from all images recorded in the experiment
(with χ varied in steps of 2°). To construct this plot, the X-ray intensity was measured by integrating
a region of the image with dimensions 62.5 μm × 192 μm at the center of the crystal, and was
normalized to give a value in the range 0 ≤ I N
t ≤ 1
1.4.2 XBI Study of Changes in Molecular Orientation
at a Solid-State Phase Transition
As the XBI study of 1-BrA/thiourea proved that the technique is a sensitive probe of
molecular orientations in materials, the next application [19] was to explore the use of
XBI to characterize changes in molecular orientations as a function of temperature,
in particular for a material that undergoes an order–disorder phase transition. To
explore this behavior, XBI experiments were carried out on a single crystal of the
thiourea inclusion compound containing bromocyclohexane (BrCH) guest molecules
(Fig. 1.3b). This material undergoes a phase transition at T = 233 K from a hightemperature (HT) phase in which the orientational distribution of the BrCH guest
molecules is essentially isotropic (as a result of rapid isotropic molecular motion) to
a low-temperature (LT) phase in which the BrCH molecules become orientationally