

1 X-Ray Birefringence Imaging (XBI): A New Technique …
13
ordered. In the LT phase, the C–Br bonds of all BrCH molecules are oriented at
ψ ≈ 52.5° with respect to the tunnel axis of the thiourea host structure (Fig. 1.3b).
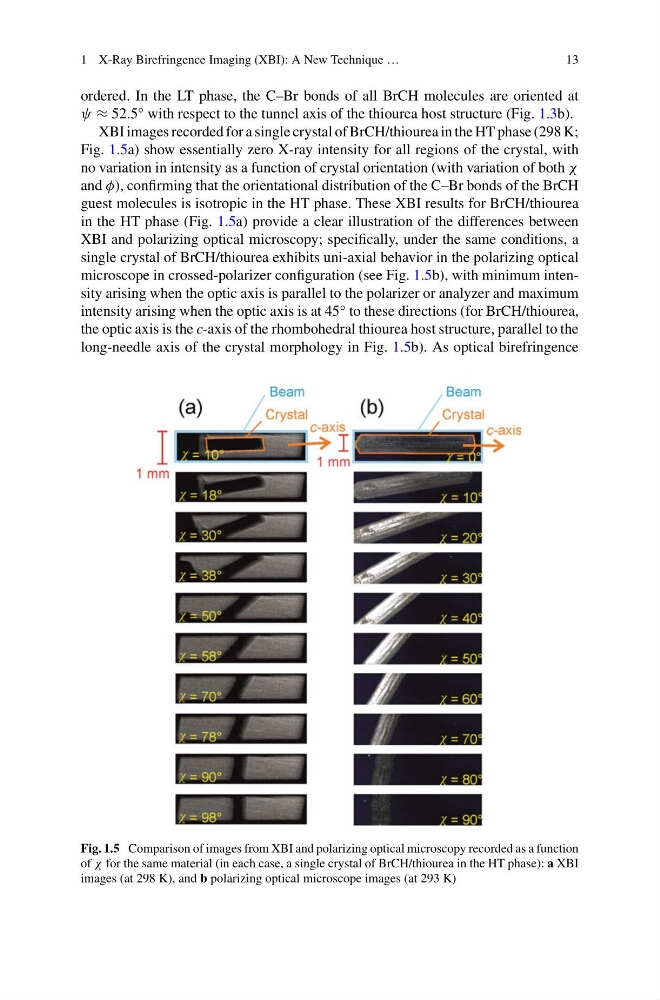
XBI images recorded for a single crystal of BrCH/thiourea in the HT phase (298 K;
Fig. 1.5a) show essentially zero X-ray intensity for all regions of the crystal, with
no variation in intensity as a function of crystal orientation (with variation of both χ
and φ), confirming that the orientational distribution of the C–Br bonds of the BrCH
guest molecules is isotropic in the HT phase. These XBI results for BrCH/thiourea
in the HT phase (Fig. 1.5a) provide a clear illustration of the differences between
XBI and polarizing optical microscopy; specifically, under the same conditions, a
single crystal of BrCH/thiourea exhibits uni-axial behavior in the polarizing optical
microscope in crossed-polarizer configuration (see Fig. 1.5b), with minimum intensity arising when the optic axis is parallel to the polarizer or analyzer and maximum
intensity arising when the optic axis is at 45° to these directions (for BrCH/thiourea,
the optic axis is the c-axis of the rhombohedral thiourea host structure, parallel to the
long-needle axis of the crystal morphology in Fig. 1.5b). As optical birefringence
Fig. 1.5 Comparison of images from XBI and polarizing optical microscopy recorded as a function
of χ for the same material (in each case, a single crystal of BrCH/thiourea in the HT phase): a XBI
images (at 298 K), and b polarizing optical microscope images (at 293 K)
13
ordered. In the LT phase, the C–Br bonds of all BrCH molecules are oriented at
ψ ≈ 52.5° with respect to the tunnel axis of the thiourea host structure (Fig. 1.3b).
XBI images recorded for a single crystal of BrCH/thiourea in the HT phase (298 K;
Fig. 1.5a) show essentially zero X-ray intensity for all regions of the crystal, with
no variation in intensity as a function of crystal orientation (with variation of both χ
and φ), confirming that the orientational distribution of the C–Br bonds of the BrCH
guest molecules is isotropic in the HT phase. These XBI results for BrCH/thiourea
in the HT phase (Fig. 1.5a) provide a clear illustration of the differences between
XBI and polarizing optical microscopy; specifically, under the same conditions, a
single crystal of BrCH/thiourea exhibits uni-axial behavior in the polarizing optical
microscope in crossed-polarizer configuration (see Fig. 1.5b), with minimum intensity arising when the optic axis is parallel to the polarizer or analyzer and maximum
intensity arising when the optic axis is at 45° to these directions (for BrCH/thiourea,
the optic axis is the c-axis of the rhombohedral thiourea host structure, parallel to the
long-needle axis of the crystal morphology in Fig. 1.5b). As optical birefringence
Fig. 1.5 Comparison of images from XBI and polarizing optical microscopy recorded as a function
of χ for the same material (in each case, a single crystal of BrCH/thiourea in the HT phase): a XBI
images (at 298 K), and b polarizing optical microscope images (at 293 K)