

amplitude of internal climate variability on multi-decadal to centennial timescales
(Hoerling et al. 2012; Kelley et al. 2012; Mariotti et al. 2015; Zappa et al. 2015).
Giorgi (2002) found a significant warming trend of 0.75
C in 100 years, over the
larger Mediterranean land area for the twentieth century. Over most of the western
Mediterranean, warming has been mainly registered in two phases: from the
mid-1920s to 1950s and from the mid-1970s onwards (e.g., Xoplaki et al. 2003).
Rapid European summer warming has occurred since around 1990 (Bador et al.
2016) at a rate of around 2.5 times the global mean temperature increase (van
Oldenborgh et al. 2009). This warming was largest in western and central Europe
and in the Mediterranean, with record-breaking heat waves and extreme
temperatures.
Using CM-SAF data records (Schulz et al. 2009), Kothe et al. (2017) and
Pfeifroth et al. (2018) found a slightly positive linear decadal trend in sunshine
duration and in surface sun radiation, respectively, in the Mediterranean, Europe,
and North Africa for the time period 1983–2015.
An increasing trend in the occurrence of extreme winter precipitation events (from
heavy to torrential) in Spain and Italy has been identified by Toreti et al. (2010).
In a similar way, observations from the last decades reveal a warmer and drier
scenario in the Iberian Peninsula in comparison to past decades. In particular,
temperatures have shown strong increases since the 1960s, so Brunet et al. (2009)
showed that in the period 1973–2005 the average rate of change estimated for
average temperature in Spain was 0.48
C per decade, while Vicente-Serrano et al.
(2014) estimated this rate in 1.5
C in the five decades 1961–2011 in the Iberian
Peninsula. Consequently, the annual evaporative demand by the atmosphere
increased, estimated at 7.3% by Vicente-Serrano et al. (2014). Meanwhile, the
relative humidity has shown a strong decrease with no significant changes in specific
humidity (Vicente-Serrano et al. 2014). The tendency toward the decrease of the
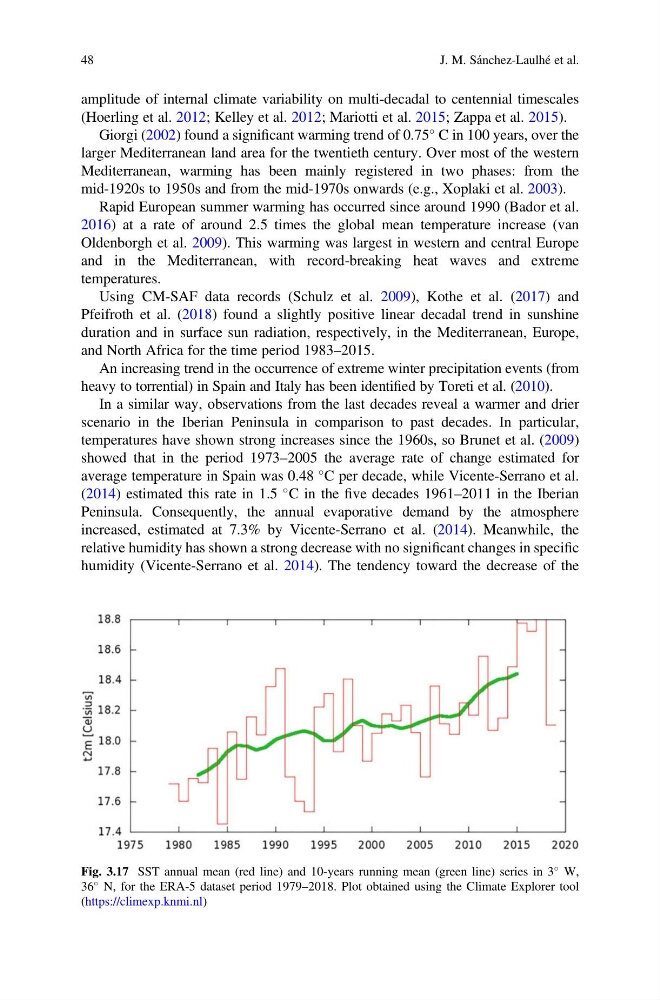
Fig. 3.17 SST annual mean (red line) and 10-years running mean (green line) series in 3
W,
36
N, for the ERA-5 dataset period 1979–2018. Plot obtained using the Climate Explorer tool
(https://climexp.knmi.nl)
48
J. M. Sánchez-Laulhé et al.
(Hoerling et al. 2012; Kelley et al. 2012; Mariotti et al. 2015; Zappa et al. 2015).
Giorgi (2002) found a significant warming trend of 0.75
C in 100 years, over the
larger Mediterranean land area for the twentieth century. Over most of the western
Mediterranean, warming has been mainly registered in two phases: from the
mid-1920s to 1950s and from the mid-1970s onwards (e.g., Xoplaki et al. 2003).
Rapid European summer warming has occurred since around 1990 (Bador et al.
2016) at a rate of around 2.5 times the global mean temperature increase (van
Oldenborgh et al. 2009). This warming was largest in western and central Europe
and in the Mediterranean, with record-breaking heat waves and extreme
temperatures.
Using CM-SAF data records (Schulz et al. 2009), Kothe et al. (2017) and
Pfeifroth et al. (2018) found a slightly positive linear decadal trend in sunshine
duration and in surface sun radiation, respectively, in the Mediterranean, Europe,
and North Africa for the time period 1983–2015.
An increasing trend in the occurrence of extreme winter precipitation events (from
heavy to torrential) in Spain and Italy has been identified by Toreti et al. (2010).
In a similar way, observations from the last decades reveal a warmer and drier
scenario in the Iberian Peninsula in comparison to past decades. In particular,
temperatures have shown strong increases since the 1960s, so Brunet et al. (2009)
showed that in the period 1973–2005 the average rate of change estimated for
average temperature in Spain was 0.48
C per decade, while Vicente-Serrano et al.
(2014) estimated this rate in 1.5
C in the five decades 1961–2011 in the Iberian
Peninsula. Consequently, the annual evaporative demand by the atmosphere
increased, estimated at 7.3% by Vicente-Serrano et al. (2014). Meanwhile, the
relative humidity has shown a strong decrease with no significant changes in specific
humidity (Vicente-Serrano et al. 2014). The tendency toward the decrease of the
Fig. 3.17 SST annual mean (red line) and 10-years running mean (green line) series in 3
W,
36
N, for the ERA-5 dataset period 1979–2018. Plot obtained using the Climate Explorer tool
(https://climexp.knmi.nl)
48
J. M. Sánchez-Laulhé et al.